Multiple Time Frame Trading methodology
Multiple time frame analysis is a top-down trading technique that allows you to use a higher time frame chart to find trend and support/resistance levels while finding the best entry signals on a lower time frame chart.
In the video above, I show you how to use the daily time frame and 4-hour time frame to do technical analysis that will increase your win rate and profitability by giving you low-risk and high-reward trades.
You can trade this strategy on any market and time frame (see my preferred time frame setups below).
multi time frame trading
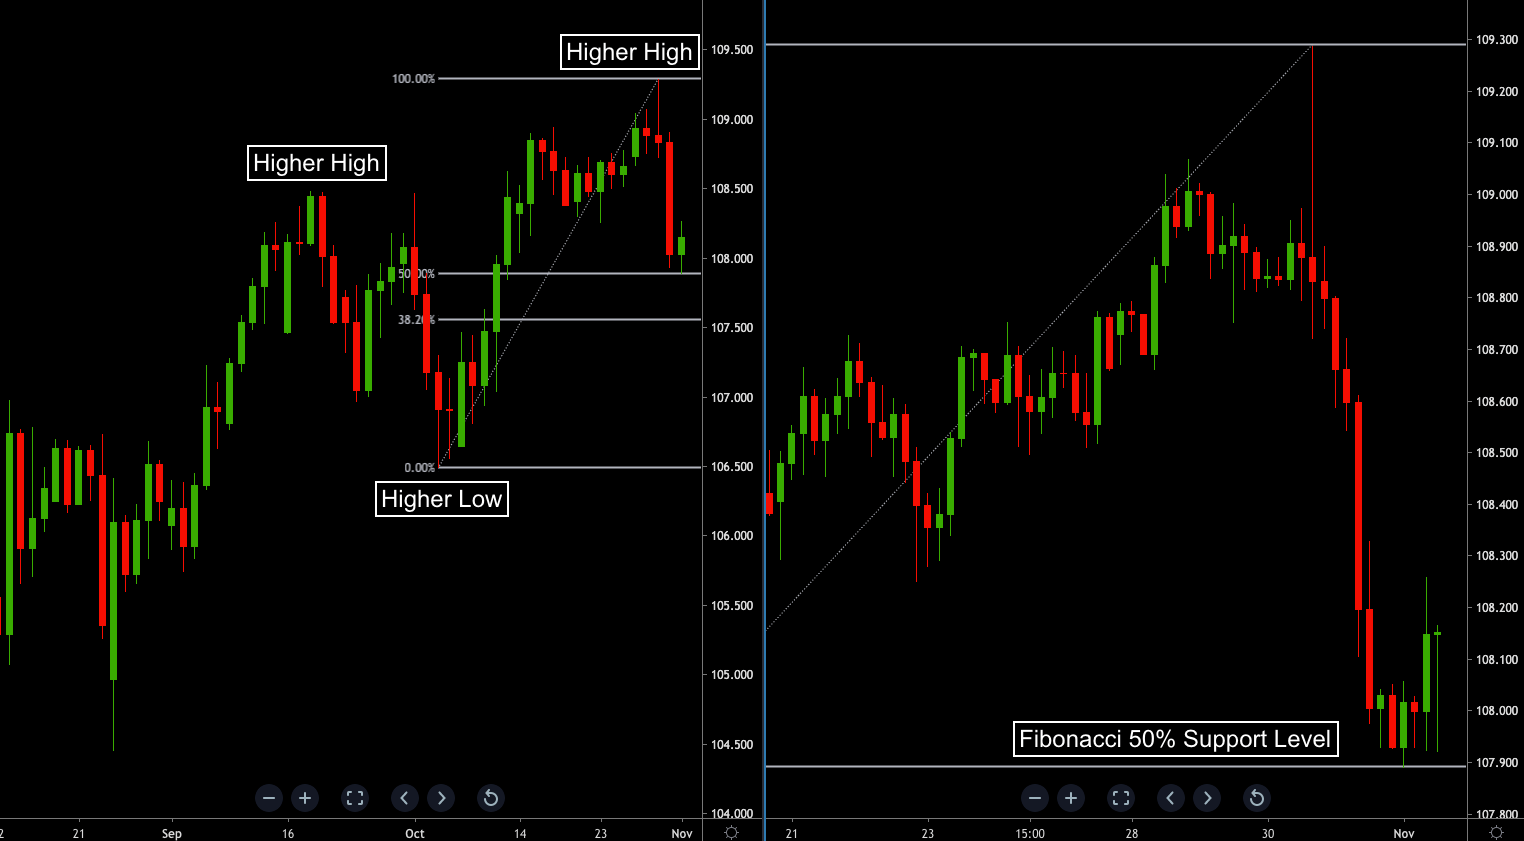
USDJPY daily and 4-hour chart by TradingView
I recommend looking at price action and structure (highs and lows) to find the trend and Fibonacci retracement to find good support and resistance levels on the daily chart.
Looking at the daily chart you can see that USDJPY made a higher high and that you're now at the 50% Fibonacci retracement support level.
For a successful trading system, you also need to find the accurate entry signals, and for that, I recommend you trade my Trend Pulse Pro V2 signals to get low-risk entries before big price moves.
If you analyze trend and levels on the daily chart and then wait for a Trend Pulse Pro V2 buy entry signals on the 4-hour chart, you can be confident that you have a very high probability of a successful trade and a high risk-reward ratio as well.
multiple time frame trading system
This system is straightforward, and you only need to focus on three steps:
1. Look at price action and structure (highs and lows) to find the trend.
2. Draw Fibonacci retracement levels between highs and lows to find support/resistance levels.
3. Enter trades in the direction of the trend at support/resistance when you get a Trend Pulse Pro V2 buy/sell signals.
This is the key to profitable trading, following a proven step by step system with signals that work.
Want to see the next signal? Get started now.
Technical Analysis in one chart

USDJPY daily and 4-hour chart by TradingView
Trading multiple time frames and doing technical analysis in one chart is an easy way to keep trade in the direction of the big picture trend. You can see USDJPY on a daily and 4-hour time frame on my recommended charting platform in the chart above. This platform is ideal if you only have one monitor or laptop to trade on or prefer to trade on your tablet or mobile phone.
Dual Time Frame Setups
You can use this methodology to trade any combination of time frames.
Trend and Fibonacci time frame: Weekly
Trend Pulse Pro V2 time frame: Daily
Trend and Fibonacci time frame: Daily
Trend Pulse Pro V2 time frame: 4-hour
Trend and Fibonacci time frame: 4-hour
Trend Pulse Pro V2 time frame: 1-hour
Trend and Fibonacci time frame: 1-hour
Trend Pulse Pro V2 time frame: 15-minute
Trend and Fibonacci time frame: 15-minute
Trend Pulse Pro V2 time frame: 5-minute
Trend and Fibonacci time frame: 5-minute
Trend Pulse Pro V2 time frame: 1-minute
Do You Want Accurate
Buy Sell Trend Signals?


I'm a family guy in my early 30's who learned how to trade the markets in a simple yet effective way. During university, I studied investing and graduated with a master's degree in risk management. Quickly, I realized that I was onto something. I started helping friends and taking students. My students started getting results, spent less time in front of their screens, and their accounts grew consistently. Learn more about me here.
What To Read Next...