

Best 50 vs 200 Day Moving Average Crossover Strategy
Enter trades. Let them play out. Profit.
Those are the goals of trading.
But if you have never traded before — or maybe you are not profitable yet — those seven words can be extremely intimidating.
Trading is not as easy as it sounds, but it's a simple process when you have learned how to trade.
The good news; while it can be difficult for beginners to trade, it's not impossible.
The moving average is the most popular trading indicator used by traders.
Here's how to trade the moving average crossover strategy to trade successfully.
How To Trade The Moving Average Crossover
One of the best moving average crossover strategies for swing and trading trading to find and trade the trend is the 200 day moving average and the 50 day moving average golden cross rule.
This strategy should not be used as an entry signal on its own but rather be used to define the current big picture trend and also give you an idea when to go long or short.
It's one of the most beginner friendly moving average strategies when traded correctly.
Important; do not simply go short or long when you get the crossover, price action will be extended at that time so it's better to wait for a retrace to a resistance or support level before you take the entry.
Two Moving Average Crossover Strategy Explained
The moving averages we will look at is the simple moving average 50 periods and the 200 periods and as you can see in the example below when we have a downtrend the 50 moving average will be below the 200 moving average and when we have an uptrend the 50 moving average will be above the 200 moving average.
You can see that the 200 moving average is the black line and the blue one is the 50 moving average.
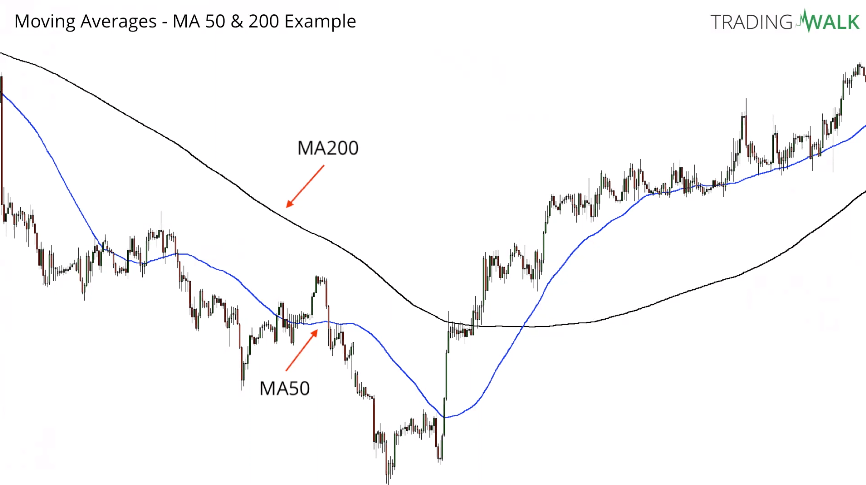
EURUSD 1-hour chart by TradingView
The 50 moving average is adopting faster to new price movements so it follows price faster if we have a quick down move the 50 moving average will start sloping faster and steeper than the 200 moving average will.
These are the best moving average for swing and day trading since they can be used for both support and resistance levels and as trend direction indication. They work on all markets including forex, stocks, crypto, indices, commodities, etc.
You can also use the moving averages with other technical analysis techniques for more confluence.
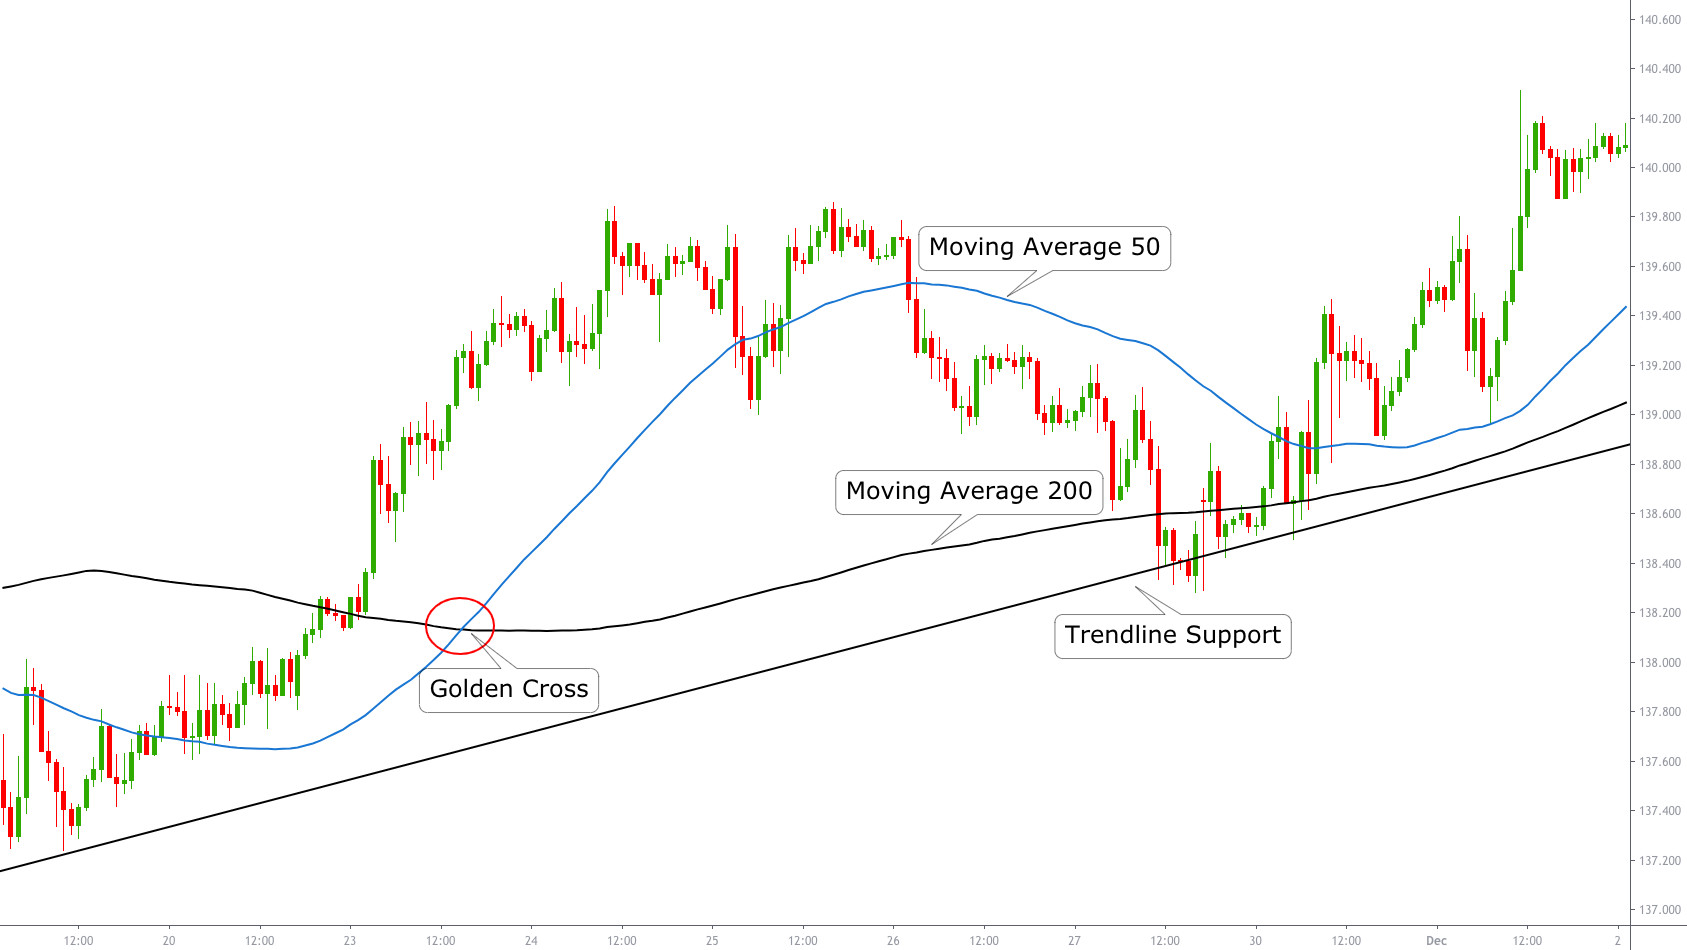
One of the best moving average strategy is the crossover strategy namely the golden cross. The golden cross rule is when the 50 moving average cross over the 200 moving average from below this a bullish sign that the trend might be changing from bearish to bullish.

EURUSD 1-hour chart by TradingView
An important note here again, you will probably not be profitable trading this strategy just as a buy signal when the 50 moving average crossover the 200 moving average because you will probably be in too late. So what I recommend is when you get the crossover wait for a retrace to support level and take entry on that support level if you get a buy entry signal.
Following this simple rule will make this one of the best moving average crossover strategies for swing trading and day trading.
Same is true for the bearish golden cross, so when the 50 moving average cross over the 200 average from above you get a bearish golden cross and you do not want to take entry when you have the cross, you want to wait for a retrace and take entry on that resistance level if you get a sell entry signal.

EURUSD 1-hour chart by TradingView
Then you want to trade bearish signals as long as you have the bearish trend in check, you have the 50 moving average below the 200 moving average. You can continue to trade resistance levels and go short at them.
So when do you take profit? A good take profit level is the next strong support or resistance level. You can also follow 10X Trading System signals to find market bottoms and tops where you can take profits.
50 And 200 Day Moving Average Rules
Uptrend – Buy at support levels if you get an entry signal as long as MA 50 is above MA 200.
Downtrend – Sell at resistance levels if you get an entry signal as long as MA 50 is below MA 200.
Trend reversal (downtrend to uptrend) – MA 50 crossover MA 200 from below. Wait for a retrace to a support level like resistance becomes support or support at the moving average 50 before you buy.
Trend reversal (uptrend to downtrend) – MA 50 crossover MA 200 from above. Wait for a retrace to a resistance level like support becomes resistance or resistance at the moving average 50 before you sell.
Profitable Moving Average Strategy
To trade moving averages profitably you want at trend and support and resistance level in confluence.
What is confluence trading?
Confluence occurs when two or more technical analysis techniques give you the indication to trade.
This is very powerful for you as a trader because it can help you get better accuracy and profitability.
For example, confluence happens when support and resistance levels are closely in line with trend when you get a buy or sell entry signal. Fibonacci retracement and extension levels, round numbers, and previous swing highs and lows can also act as strong levels.
Confluence trading works on all time frames and no matter if you trade forex, stocks, commodities, etc.
The more techniques that confluence, the higher the probability trade setup you have.
Here are 3 techniques to find strong levels you can use in confluence with the moving averages:
GBPJPY 1-hour chart by TradingView
One easy technical analysis technique to find support and resistance is to draw trendlines.
By drawing trendlines between bottoms and tops, you find good support and resistance levels.
You can extend this into the future as long as they stay unbroken.
An advanced technical analysis technique is to copy the trendline in the chart above and connect it tops to be used as a good take profit target.
You can also draw a mean line between the upper resistance trend line and the lower support trend line. The mean trendline is a very strong support and resistance level most traders forget.
2. Fibonacci Retracement Support And Resistance Levels

GBPJPY 1-hour chart by TradingView
Fibonacci retracement is a very good technical analysis technique to find strong levels of support and resistance. You draw a Fibonacci between the high and low of a strong price moves either up or down.
When you draw a Fibonacci a number of horizontal lines are drawn automatically.
The strongest lines are at 0%, 38.2%, 50%, 61.8%, and 100% of the length of the price move.
My favorites are the 50% and 38.2% (some platforms show 61.8%) Fibonacci retracement levels.
The zone between the 50% and 38.2% level is called the golden zone (you often see price bounce here).
3. Change Of Polarity Support And Resistance Levels

GBPJPY 1-hour chart by TradingView
The change in polarity technique is a way of finding strong levels, once a level is broken, a support level becomes a resistance level. Similarly, a resistance level becomes a support level once it's broken.
For example, in the chart above you can see price bounce on resistance levels. When the resistance levels finally break, there is a high probability these levels will act as a support levels in the future.
Look closely in the chart above and you will see some more examples of both support becomes resistance level and resistance becomes support level. I quickly identified 9, can you find them?
Moving Average Entry And Exit Points

GBPJPY 1-hour chart by TradingView
When you have done your technical analysis, found the trend and a strong support or resistance level, you want to find an entry signals with a good risk reward ratio.
Following 10X Trading System buy and sell signals, you get entry signals with a good risk reward ratio.
Buy Trade Entry Point:
Trade 10X buy signal when trend is up and you are at a support level. Place stop loss below support.
Buy Trade Exit Point:
Take profit on 10X sell signal at new high or take profit using trailing stop loss.
Sell Trade Entry Point:
Trade 10X sell signal when trend is up and you are at a support level. Place stop loss above resistance.
Sell Trade Exit Point:
Take profit on 10X buy signal at new low or take profit using trailing stop loss (at explained 2:00 in the video).
3 moving average crossover strategy
You might think that the three 50, 100, and 200 moving average crossover strategy is better to identify trends and find entries based on those trends than the two moving average strategy.
However, this strategy has without a doubt its drawbacks, and it is important you understand its drawbacks before using it in your trading.
One of the main drawbacks of the three 50, 100, and 200 moving average crossover strategy is that it can result in too much "noise" on your chart. When you plot multiple moving averages on the same chart, it can be difficult to read the signals and you filter out too many good signals.
Because the 100 moving average is slower than the 50 moving average you are also likely to get late entries as 100 is lagging price more.

TSLA daily chart by TradingView
Another issue with using three moving averages is that the shorter-term averages (50 day and 100 day) can be prone to more false signals in identifying the underlying trend than the longer-term average (200 day).
One way to avoid this is to use only the 50 day and 200 day moving averages. The 50 vs 200 day moving average crossover strategy help to reduce the amount of noise on your chart and is usually more reliable in identifying the underlying trend.
Magnet 200 day moving average rule

TSLA daily chart by TradingView
Can you only use the 200 moving average?
Well, the magnet 200 day moving average rule is a trading strategy that involves only using the 200 day moving average as a key level of support and resistance.
You sell if price is trading above the 200 day moving average with the moving average as take profit target and buy if price is trading below the average with the moving average as take profit target.
This strategy is based on the idea that prices tend to revert to the average over time and that the 200 day moving average represents a magnet, level of support and resistance.
While the magnet 200 day moving average rule is not a widely known trading strategy, it can be a profitable one if you identify reversals after extended and exhausted trends and take advantage of them.

Johan Nordstrom is a full-time trader, and a family guy in his early 30's who trades the markets in a simple yet effective way. He has a master's degree in risk management and years of experience trading the markets. He has helped hundreds of struggling traders become consistently profitable. Read more.

The 10X Trading System
- Access to 10X Trading System
-
Step by Step Video Training
- Reliable Non-Repaint Signals
-
Trade Any Market on Any Device
-
24/7 Priority Support