Trading Walk
Courses       Reviews       Resources       Login
Trading Walk
Courses       Reviews       Resources       Login

Top 5 Technical Analysis Techniques And Strategies

Want 5 profitable technical analysis techniques and strategies?

You can one or more of these techniques and strategies to step by step increase your win rate and risk reward ratio to trade more successfully.

There is no holy grail out there, you will not make consistent profits to simply take a trade when the MACD crosses or stochastic is oversold like most retail traders try to do.

Learn how to read price action (the relationship between buyers and sellers).

What I do, and what you recommend you do as well, is to trade a system with an edge based on price action, trends, and levels in confluence with these TA techniques.

Learning the advantages of technical analysis will help you become a better and more profitable trader.

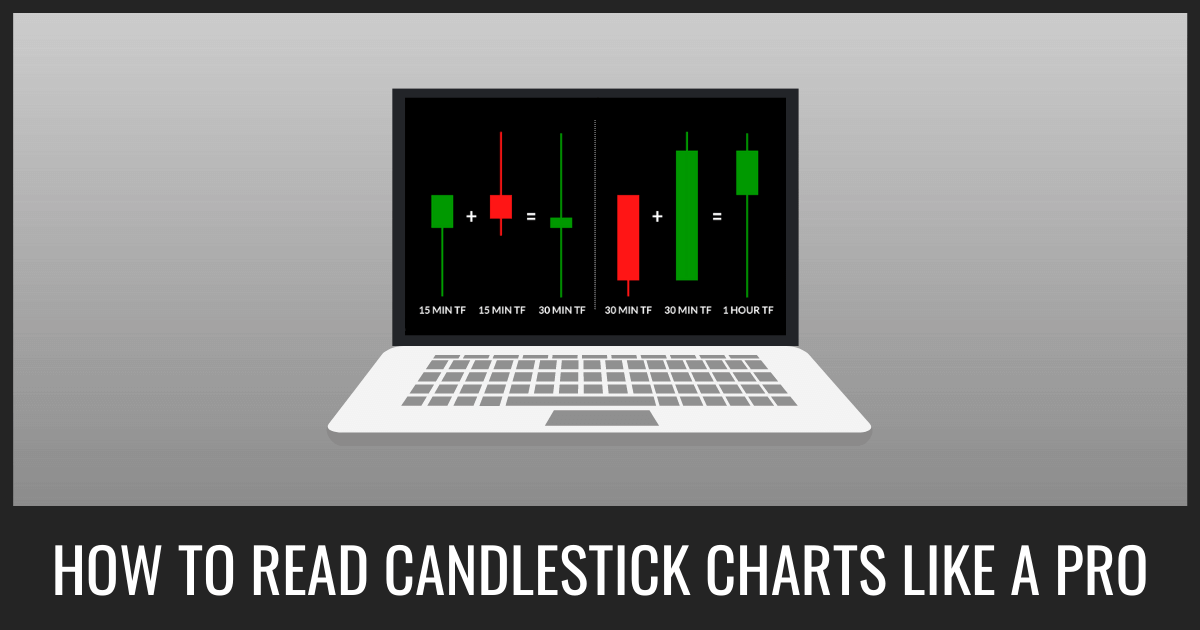
Understanding how to read candlestick charts is the first step you should master, then, take advantage of these technical analysis techniques and strategies.

Technical Analysis Chart Techniques

Here are the top 5 technical analysis techniques and strategies used by successful traders that we cover in this guide:

1. Support And Resistance Levels
2. Volatility 
3. Symmetry

4. Trendlines

5. Candlestick Patterns

To perform technical analysis you need a live charts. 

The best part?

Most charting softwares today are free.

1. Support And Resistance Levels

technical analysis basics
AUDUSD 1 hour chart by TradingView
Support and resistance levels and zones or whatever you want to call them are essential in trading.

The importance of levels is huge because of major banks, institutions algorithms trade at a specific price level that creates turning points that make them key levels where you can enter and exit your trades.

You must understand these basic trading principles on support and resistance levels if you want to become a successful day or swing trader.

Reading technical analysis trading books is a good way to learn more about support and resistance. 

How do you trade support and resistance levels?

You do technical analysis of charts to find levels where the price previously find support or resistance and then trade these levels following for example 10X buy and sell signals.

How To Find And Trade Support And Resistance Correctly

1. Analyze recent highs (tops) and lows (bottoms).

2. Draw horizontal lines at these levels.
 
3. Levels above price will act as resistance and levels below price will act as support.

4. Trade in the direction of the trend.

5. Bullish trend – When resistance levels break (up trend, new highs are formed), you want to buy if you get a 10X buy signal when price retrace support.

5. Bearish trend – When support levels break (down trend, new lows are formed), you want to sell short if you get a 10X buy sell when price retrace resistance.
how to find support and resistance levels
USDJPY daily chart by TradingView
how to trade support and resistance levels
GBPJPY daily chart by TradingView
One of my favorite technical analysis techniques to find good horizontal support and resistance levels is Fibonacci retracement and extension levels.

Support And Resistance Strategy

Support And Resistance Zones

Supply and demand are the cause of these support and resistance levels and though they are easy to spot, using this simple trading strategy or building your trading plan around these levels will give you the best trading strategy you can have.

You can use the techniques in this strategy to improve the edge in your current strategy or find a way to use that fits your trading style.

Remember that levels are not exact and a good way to look at them like zones.

When you set your stop loss, you will not place it just below to level but rather adjust the position size down and place a bigger stop loss.

2. Volatility

technical analysis tools
USDJPY 1 hour chart by TradingView
What is volatility? 

In simple words, you can say that volatility is a measure of how large the price moves are.

The higher the volatility, the "higher the risk".

When the market shift from low to high volatility is often where the best trading opportunities appear.

For example, when price spikes into a level late in trends you often see a trend reversal.

And when price spike out of a level after a low volatility period, you often see it combined with a breakout technical pattern.

3. Symmetry

technical analysis example
GBPUSD daily chart by TradingView
Symmetry is something you can use to find levels where the market probably will pause or reverse.

Price will often have similar swings and you can use that as a good trading strategy.

Symmetry is so powerful and and will give you an advantage. You can see that in the video above.

4. Trendlines

How do you draw a trendline correctly?

You draw a trendline by connecting at least two swing high or lows and extending the trendline into the future to show you the direction of the trend and resistance and support levels you can trade.

Below you will see a simple trend following strategy on how to trade trendline bounces and find strong support and resistance levels using trendlines.

To be successful in trend trading, you do not want to fight the market but instead, recognize and follow the trend (the trend is your friend).

A trendline is a line that connect at least two highs or at least two lows and extended into the future to show you the direction of the trend and possible resistance and support levels.

Trendlines are a very visual and reliable representation of support and resistance in any timeframe.

How To Find And Draw Trendlines Correctly

1. Find recent highs and lows.

2. Draw a trendline between (and extend) rising bottoms for an uptrend.

3. Draw a trendline between (and extend) falling tops for a downtrend.

4. Trade in the direction of the trend.
 
5. Bullish trend – When you have a bullish trendline, uptrend, you want to enter on the first bounce of the trendline that you have extended from the previous rising lows.

5. Bearish trend – When you have a bearish trend line, downtrend, you want to enter on the first bounce of the trendline that you have extended from the previous falling tops.

Three Touch Trendline Trading Strategy

The three touch trendline strategy is the best way to trade bounces on trendlines.

These bullish and bearish levels of support and resistance will give you good trades if you know what to look for and trade in the direction of the trend.

Trendlines are created by connecting rising bottoms to show an uptrend, or falling tops to indicate a downtrend. At least two swing bottoms or tops are needed for it to be a valid and strong trendline.

You want to take your trade at the third touch and expect a bounce from the line or watch for a possible break of the trendline giving you an opportunity to trade the trend reversal.
how to use trendlines
EURJPY daily chart by TradingView
how to draw trend lines correctly
AUDUSD 4-hour chart by TradingView
In your trendline analysis, remember that levels are not exact and sometimes price will reverse before the support or resistance level and sometimes not.

You can also duplicate trendline (connecting tops of the swing for a bearish trend and bottoms for a bullish trend) and move it to the opposite points constructing trendline channel to get your take profit targets.

This simple trend following trendline trading strategy can be used for both a day and swing trading.

Why Trade With The Trend?

Any trend following strategy is based on the technical analysis of market cycles and tend to move upwards or downwards over time. 

An uptrend in trading is when the market cycles up making higher highs and higher lows. 

A downtrend is when the market cycles down with lower highs and lower lows.

How do you trade trend following strategies profitably?

First step, you need to analyze the market to determine the trend (a good way is drawing trendlines).

Second step, you need some rules that will help you determine when it's the best to enter and exit trades.

Third step, you trade the trend, until the end when it "bends".

How can you actually use this?

A trend trader aim to buy in cycle lows and sell in cycle highs (in an up trend) or short in cycle highs and cover in cycle lows (in a down trend).

“The trend is your friend” is one of the best known trading quotes, although it’s message is incomplete. The complete quote should be, “The trend is your friend, until the end when it bends.”

Trading with the trend give you a higher trading edge (an advantage over other people).

Trading with the trend is a simple rule that gives us an edge when trading, and it is important because trading is a zero-sum game, those with a trading edge win, and those without one lose.

5. Candlestick Patterns

The bullish engulfing candlestick pattern is a powerful strategy for trading bottom reversals. It can be identified on a chart when a small red candle is followed by a large green candle. This pattern is called an "engulfing" pattern because the green candle "engulfs" the preceding red candle, meaning that the green candle's body completely covers the body of the red candle.

The bullish engulfing candle pattern is often more reliable if it appears after a period of consolidation or if it is accompanied by high trading volume. This indicates that there is strong buying interest behind the candlestick pattern and that the reversal may be more likely to occur.

This pattern is a good technical analysis techniques to identify bullish reversal points in the market. The bearish engulfing candle is a good technique to identify bearish reversal points. The bearish engulfing can be identified on a chart when a small green candle is followed by a large red candle.

Then learn to trade the bullish engulfing candlestick pattern and use the three trading confluence upgrades below to increase win rate and risk reward ratio when trading this simple candle pattern.

The doji candlestick pattern strategy is a simpler candlestick trend strategy with a high win rate.
engulfing candle
So what are the engulfing candle rules explained in more detail?

The first thing you need for a the bullish engulfing candle is a downtrend and at the bottom you want a bearish candle. 

You then want a bullish candle that opens at or below the previous close, and closes at or above the previous open. 

You also want the close to be near the high of the candle, so no tails on the upside. 

After the close, you get an engulfing bullish reversal, meaning you can expect price to move higher because buyers are in control.

The bullish engulfing pattern has a high reliability.
two bullish engulfing patterns
EURUSD daily chart by TradingView
At the green check marks above you can see two bullish engulfing pattern and as we talked about you first have a minor or major downtrend and a bearish candle at the bottom. You then have an open of the bullish candle at or below the previous close, and a close at or above the previous open. You can see here we close above the previous candle.

We go from a move down, forming the the bullish engulfing, and then a move up.

There are more ways to read candlestick charts, keeping it simple is most often the best way.

Now, I want to show you three upgrades you can use to get more winning trades using the bullish engulfing candle.

Bullish Engulfing Candle Pattern Strategy

Bullish Engulfing Technical Analysis Confluence

1. Uptrend

The first confluence trading upgrade you want to look for is to always trade in the direction of the trend.

You can see in the chart that we are making higher highs and higher lows (uptrend).

When you trade the bullish engulfing candle pattern in a retrace/pullback the direction of the trend you are basically taking a reversal trade of the retrace/pullback but a trend trade of the big picture trend.

2. Support

The second confluence trading upgrade you want to look for when trading the bullish engulfing candle is support levels.

You can see in the chart that we have a previous resistance becomes support level at the level where the bullish engulfing candle appears. 

This is a strong and reliable support level that increase the probability of a successful trade.

You can use any method you want to find strong support and resistance levels. 

Some of the most popular methods are Fibonacci retracement levels and moving averages.

3. Round Numbers

The third confluence trading upgrade you want to look for is even or round numbers.

You can see in the chart you have the bullish engulfing candle right at the 1.2800 level. 

Round numbers are often support and resistance key levels you should find and trade.
confluence engulfing candle strategy
GBPUSD daily chart by TradingView
Enjoyed this Guide? Tweet It
CUSTOM JAVASCRIPT / HTML
Johan Nordstrom Professional Trader Risk Management
Johan Nordstrom is a full-time trader, and a family guy in his early 30's who trades the markets in a simple yet effective way. He has a master's degree in risk management and years of experience trading the markets. He has helped hundreds of struggling traders become consistently profitable. Read more.
What To Read Next
Top 10 Trading Books For Beginners
Moving Average Crossover Strategy
Top 10 Trading Movies
© Trading Walk    Privacy    Terms    Disclaimers    Contact
YouTube
Facebook
Twitter
© Trading Walk    Privacy    Terms    Disclaimers    Contact