one minute candlestick trading strategy
How can you use a single candlestick to profit from one minute trading?
In this guide, you will learn the key construction of the candlestick setup and a simple and profitable one minute candlestick trading strategy for beginners anyone can use to trade candlesticks successfully on any time frame.
I trade on this broker and use 1 minute expiration and focus on pairs with +80% payout.
The 1 Minute Candlestick Strategy
Let's look at the setup for the one minute strategy:
See live trading examples of the one minute trading strategy.
Price action and candlestick strategies are some of the best trading strategies and techniques you should focus on in your trading.
When you learn how to read candlestick charts and develop a strategy with price action in its core, you will be able to read market sentiment and crowd psychology.
Don't worry if you don't understand everything at first.
After all, every successful trader was a beginner at one point. You, too, can learn these skills.
In an up or downtrend, the doji can be an indication that the trend is about to end if traded as a reversal or an indication that the trend is only taking a pause (consolidation before a new breakout).
Candlesticks, where the body is one-third of the high to low range of the candle, is a doji in this setup definition.
Other traders might use other names (spinning tops, etc.) depending on where in the range the doji open and closing price occurs. Still, I recommend you keep it as simple as we do.
In this one minute candlestick trading strategy:
– We trade buy long signals and sell higher in uptrends.
– We trade sell short signals and cover lower in downtrends.
This strategy works great for both scalping and binary trading.
For beginners, I recommend using it for binary trading.
So if you want to trade this strategy profitably;
I recommend you trade on a commission-free broker.
One Minute Candlestick Trading Strategy Rules
You can use this strategy for scalping and binary trading.
Let's first look at the binary trading rules (most beginner friendly).
Binary Strategy Rules
Buy Long Setup Binary Trading Rules (Beginner Friendly):
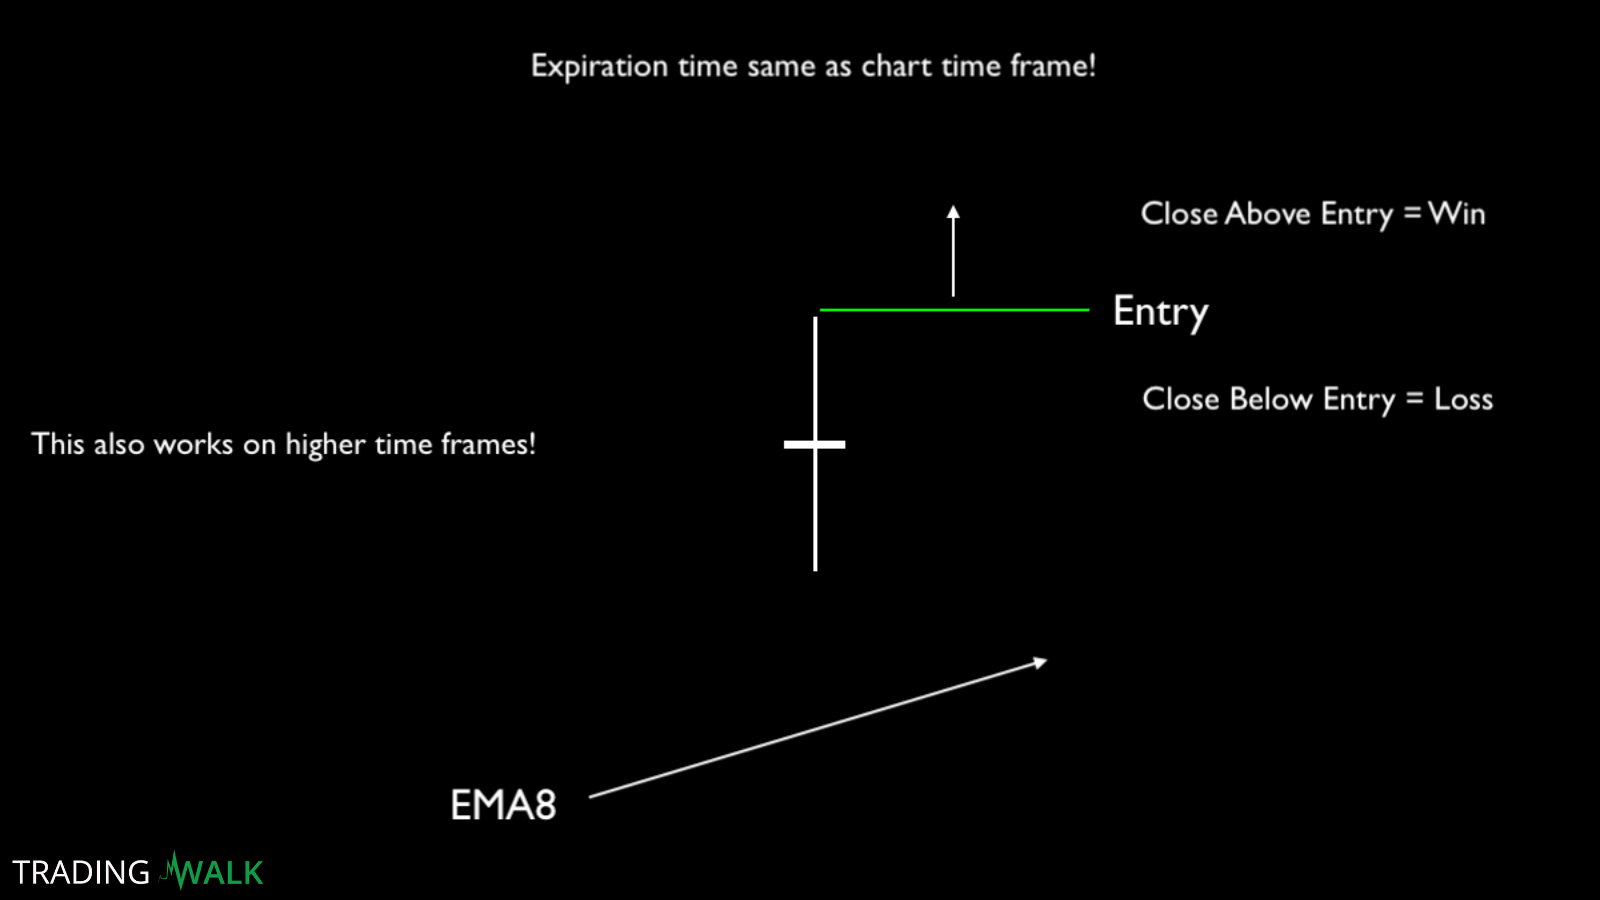
1. A doji with its high above the exponential moving average 8 (EMA8).
3. Entry with 1 minute expiration when price breaks the high of setup doji.
4. Let trade run to expiration.
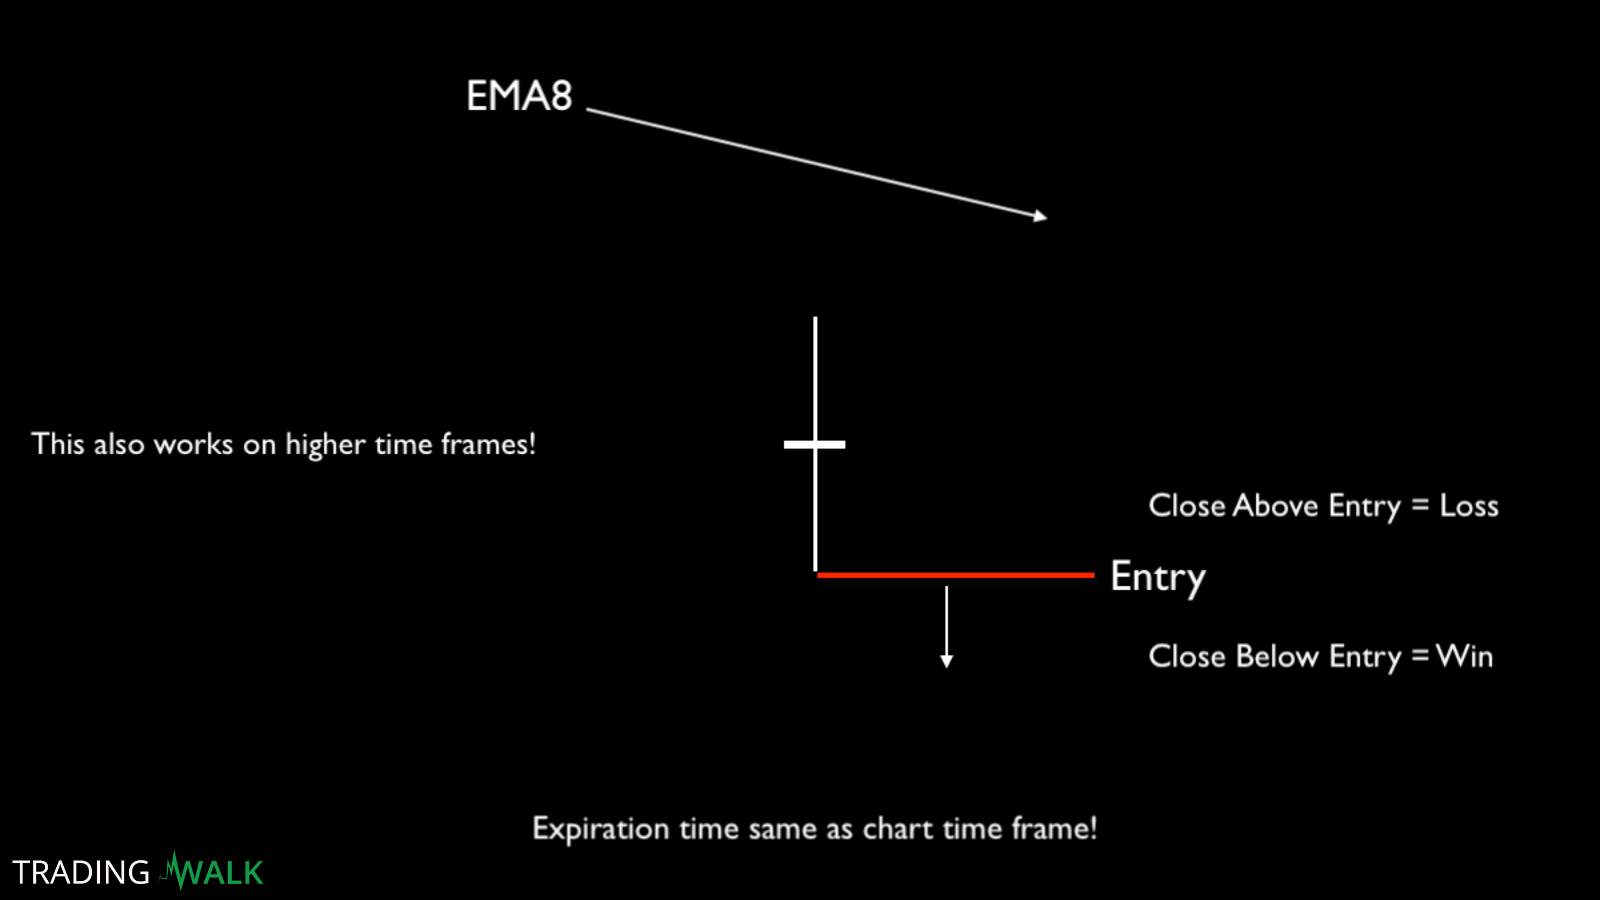
Sell Short Setup Binary Trading Rules (Beginner Friendly):
1. A doji with its low below the exponential moving average 8 (EMA8).
3. Entry with 1 minute expiration when price breaks the low of setup doji.
4. Let trade run to expiration.
Live Trading
I trade the one minute strategy on this broker (trusted worldwide and also accept European and the USA traders).
Payouts are higher than most other brokers, a $50 minimum deposit, and commission-free trading. You can use the promo code WELCOME50 for a 50% first deposit bonus.
They have an iOS and Android app available as a free download on their website.
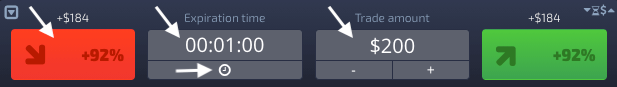
If you get an one minute doji cande buy signal, choose expiry time 1 minutes, enter your trade amount, and click green higher at the break of the high of the doji.
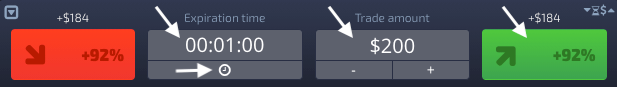
If you get an one minute doji cande sell signal, choose expiry time 1 minutes, enter your trade amount, and click red lower at the break of the low of the doji.
Binary Live Chart Analysis
How to set up, read, and analyze your binary options live charts on the platform to trade the one minute candle strategy correctly:
1. Launch chart and set the chart type to candles and time frame 1-minute:

2. Add the moving average tool to your chart that we use in the one minute strategy:

3. Set the moving average to period 8 and EMA (exponential moving average) and save:

4. Set the binary expiration time to 1 minute and trade amount to your risk tolerance:
5. Wait for a setup for the one minute candlestick trading strategy end enter trade:
Scalping Strategy Rules
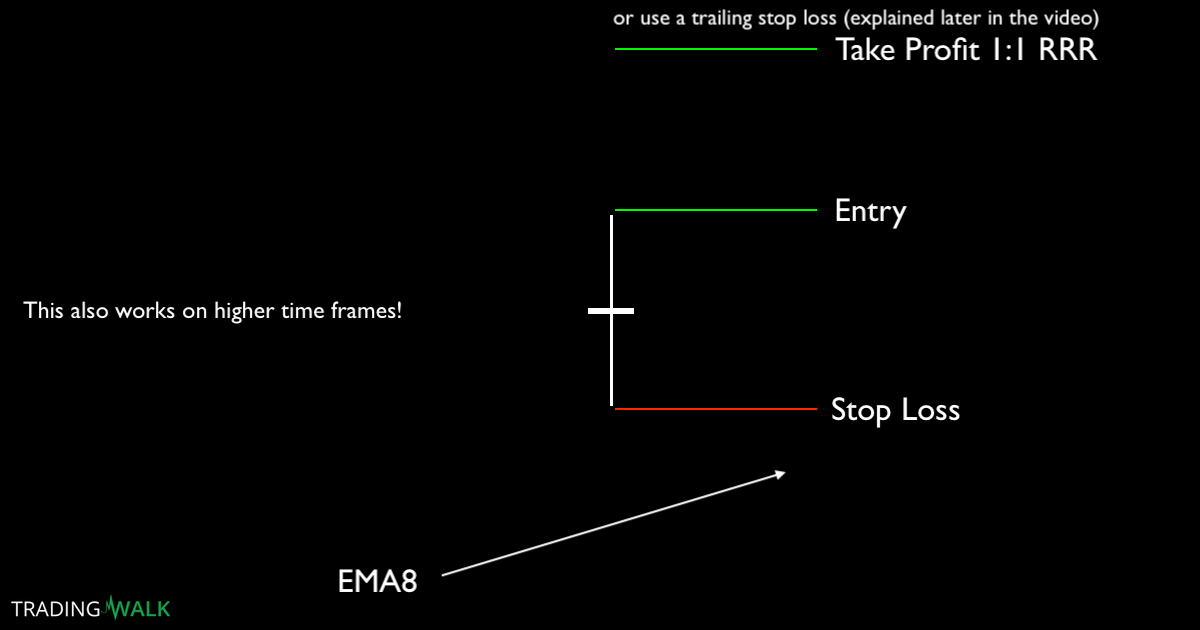
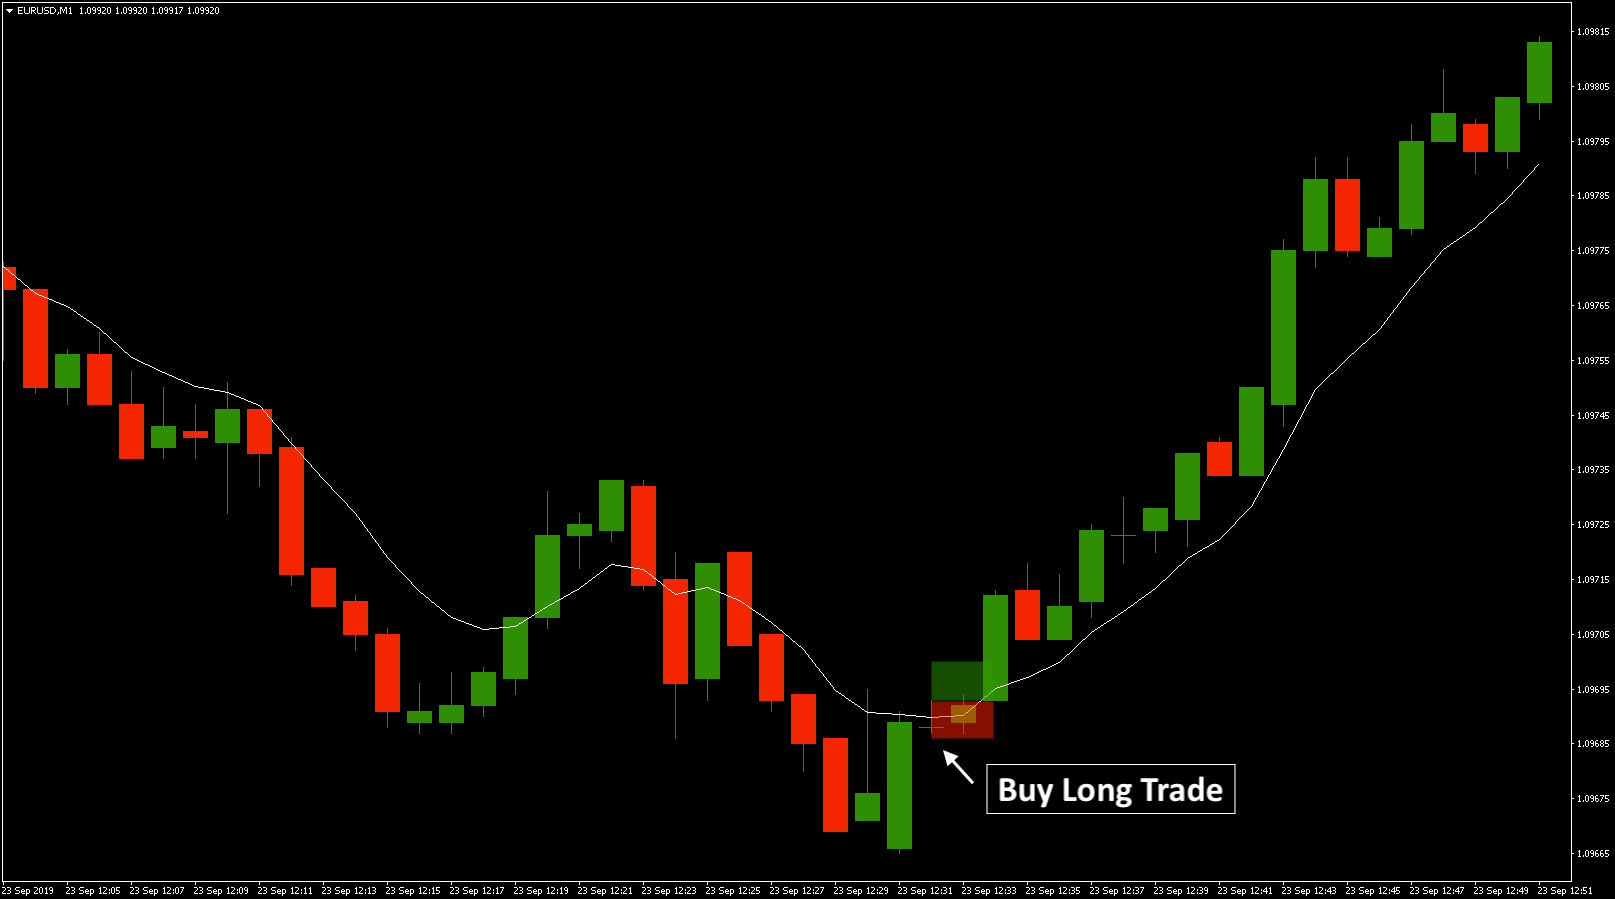
Buy Long Setup Scalping Rules:
1. A doji with its high above the exponential moving average 8 (EMA8).
2. The doji’s lower shadow is as long or longer than the upper shadow.
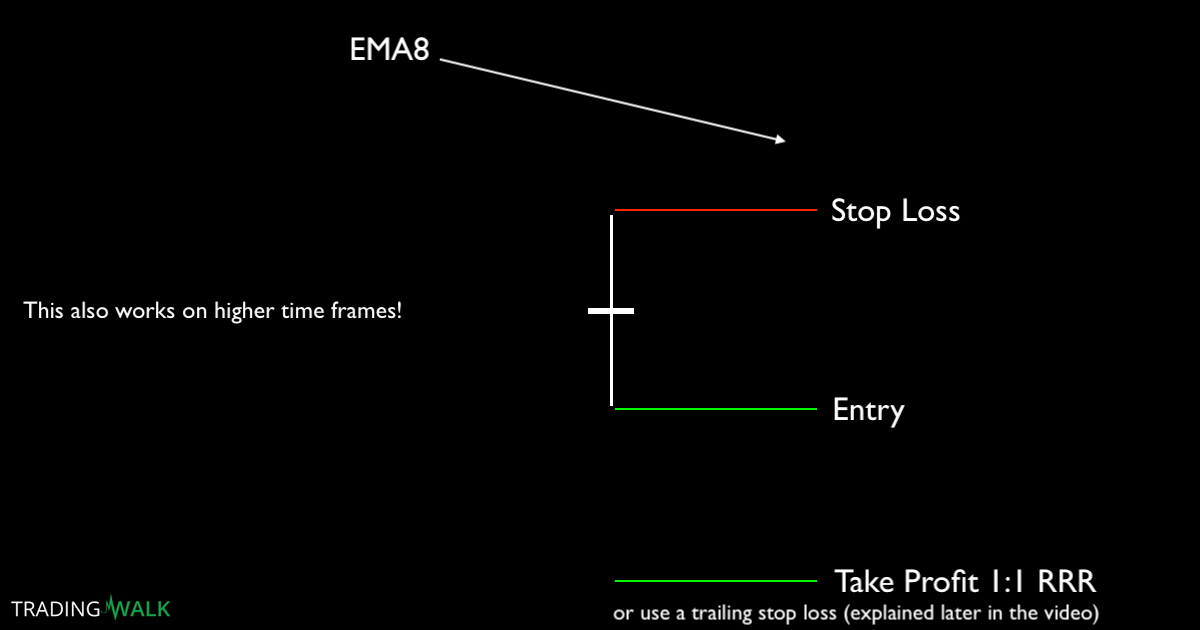
3. Entry on stop limit order when price breaks the high of setup doji.
4. Place your stop loss below the low of setup doji.
5. Place your target that gives you a 1:1 risk reward our trailing stop loss using EMA8.
Here you see the advantage of using a trailing stop loss (+10 risk reward ratio trade):
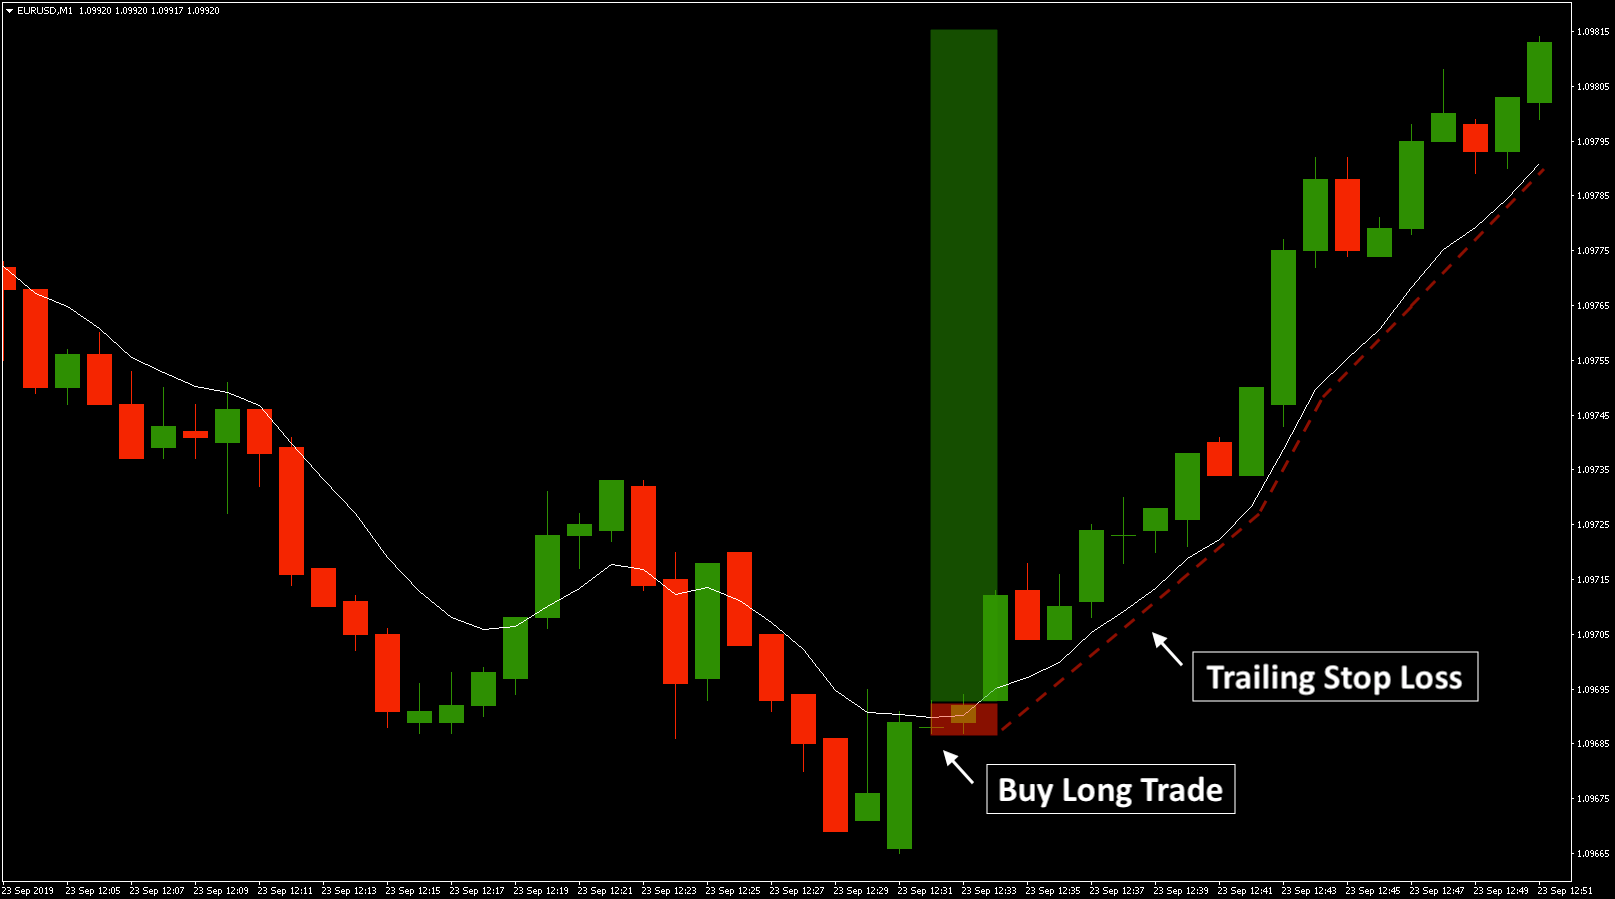
The key to consistent profits when you scalp this strategy is letting your profits run using a trailing stop loss. You might not win as many trades as when applying this technique, but the risk reward ratio on those winners is next level when you do.
Compared to placing a take profit at 1 risk reward ratio:
The advantages of this one minute candlestick strategy is that we can use it in both up and downtrends.
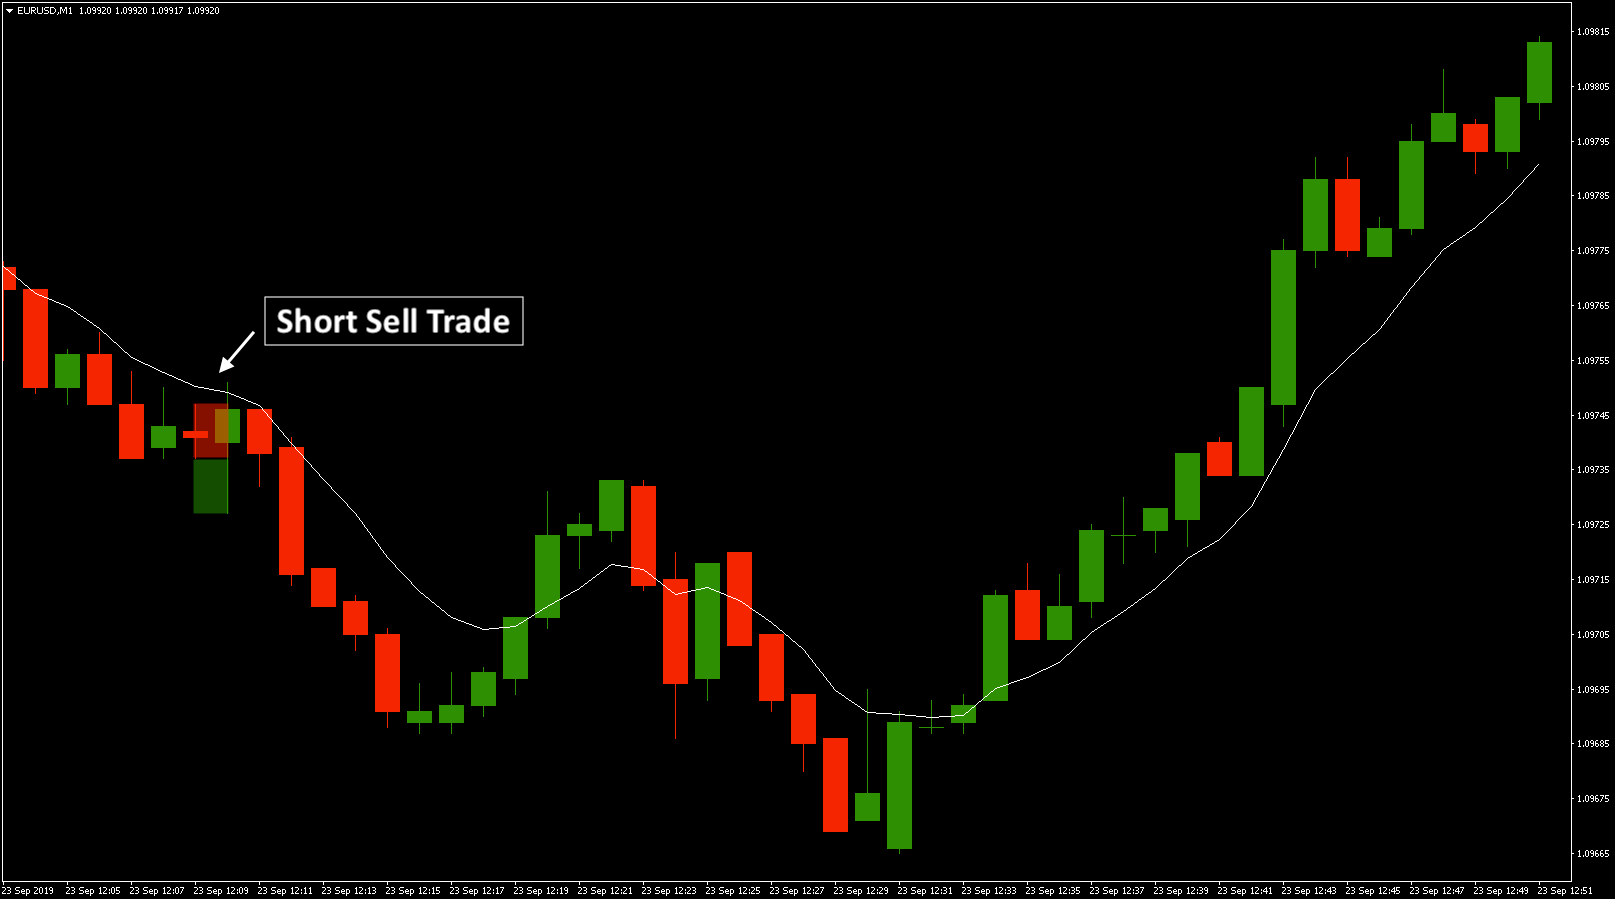
Let's look at the short sell setup for scalping this strategy in down trends:
Sell Short Setup Scalping Rules:
1. A doji with its low below the exponential moving average 8 (EMA8).
2. The doji’s upper shadow is as long or longer than the lower shadow.
3. Entry on stop limit order when price breaks the low of setup doji.
4. Place your stop loss above the low of setup doji.
5. Place your target that gives you a 1:1 risk reward our trailing stop loss using EMA8.
Price action and candlestick strategies are the best trading strategies and techniques you should focus on in your trading. Trade a strategy with price action in its core and you will profit and become better at market timing.
Price Action Candlestick Charting
Candlesticks are a way to represent price.
You can get free live candlestick charts with most free charting softwares.
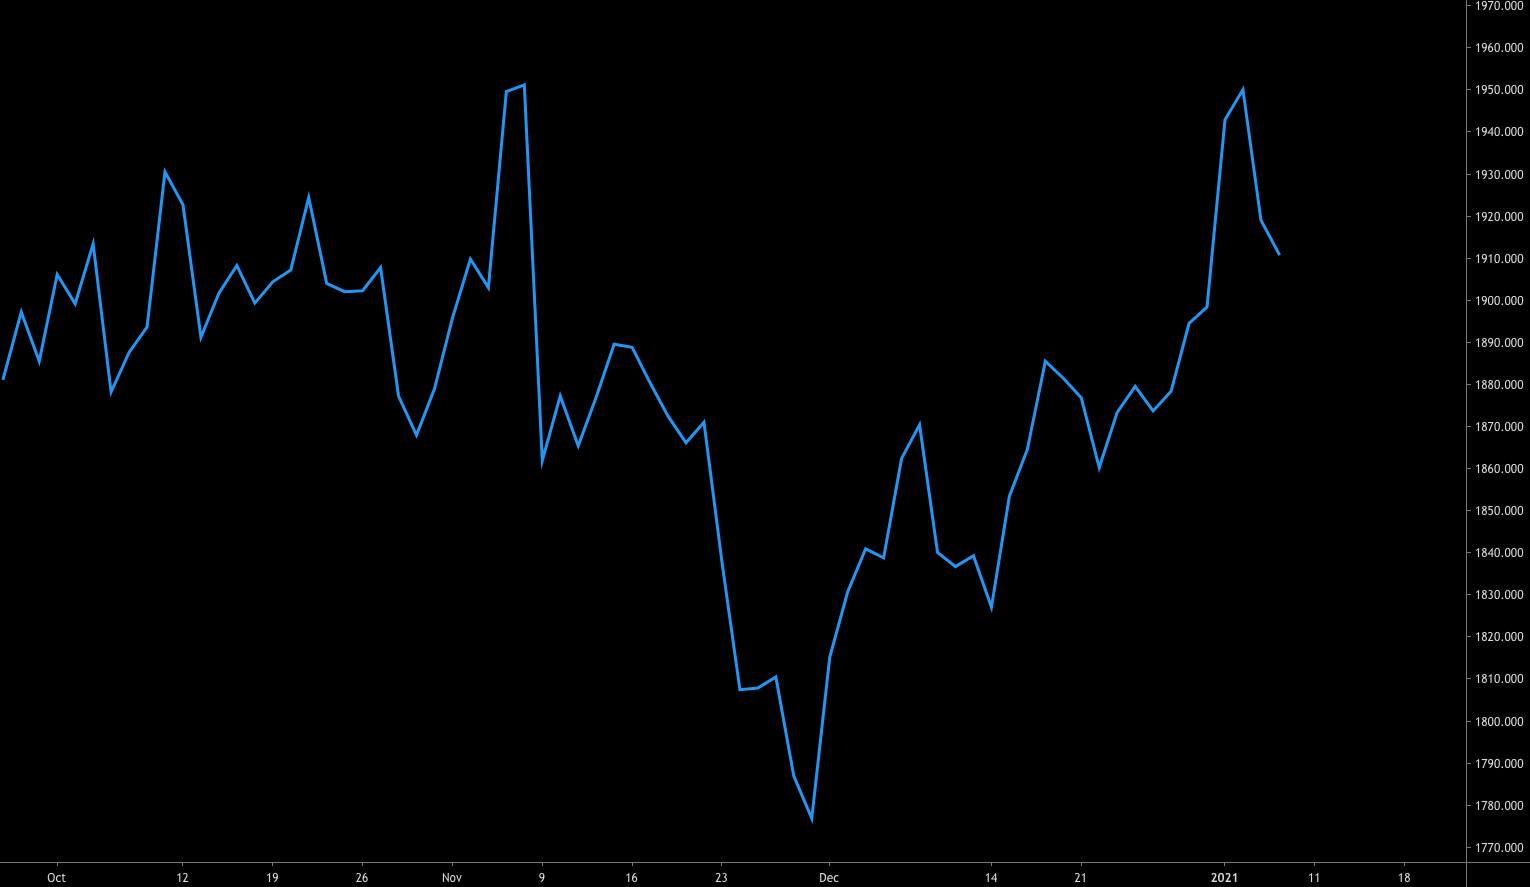
Compared with a simple line charts which only give you the closing price for the session (week, day, hour, minute…), candlestick charts give you much more information; closing, open, high and low price for the session.
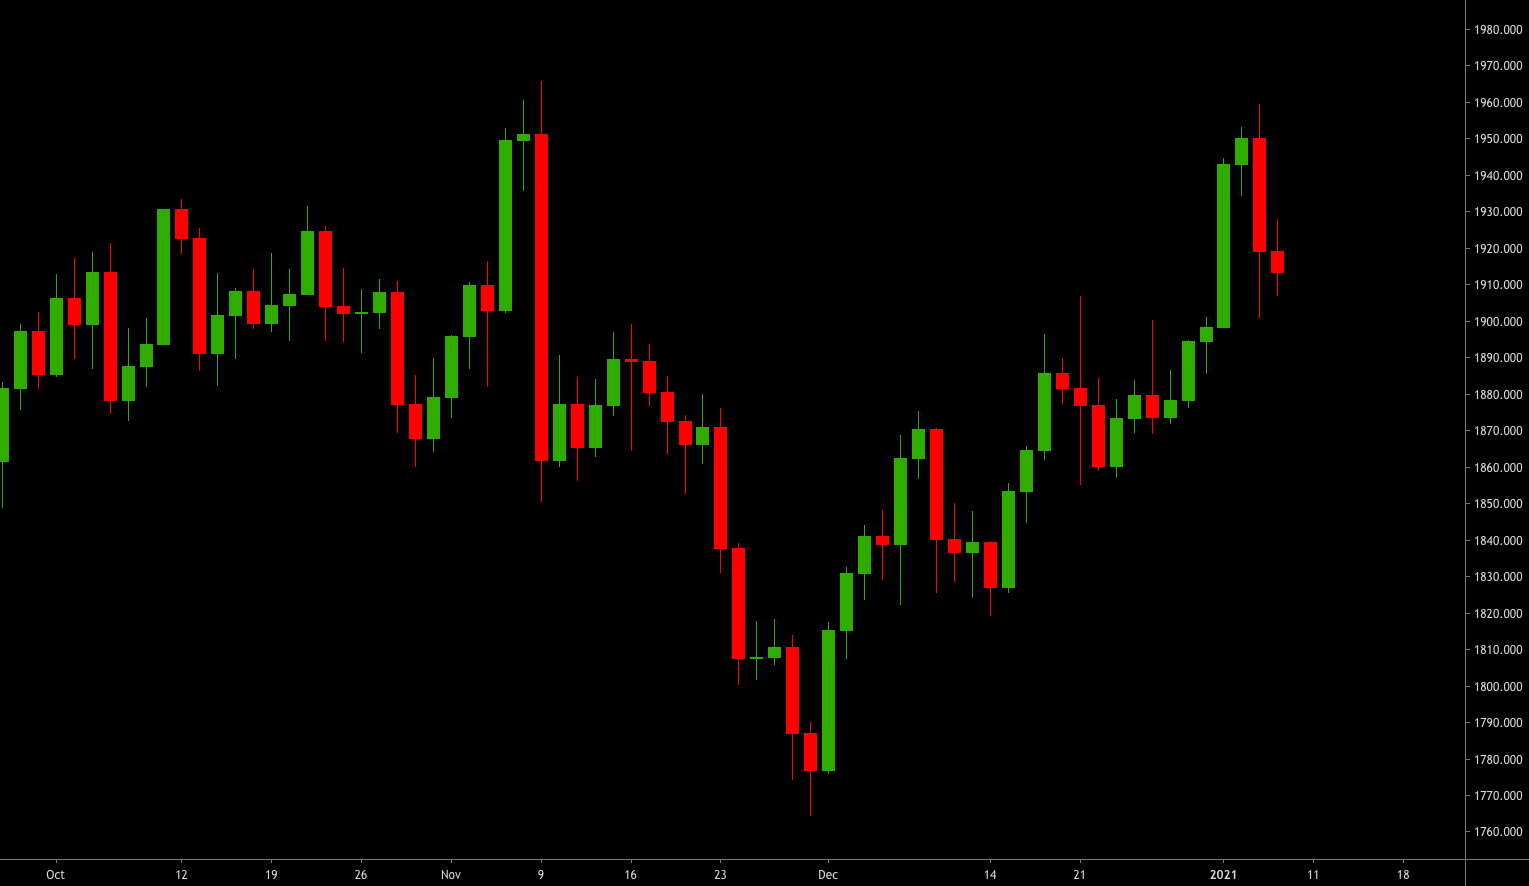
The line chart only shows a line giving you little information.
Not enough information to trade any time frame successfully.
And by analyzing the number and average size of red to green candles, we can see that the trend is down if we have more red candles than green candles and the average size if larger for red candles:
Having the insight of change in sentiment and how traders react to price movements provides the candlestick trader with a powerful advantage.
Candlestick charting makes it easier for you to deal with the psychology of trading and feelings like greed and fear and I think candlestick trading is the best tool to achieve improvements that result in more profits for both swing and day trading.
Candlesticks techniques and strategies will give you:
- An edge in the market
- Simple and easy to understand charting
- Powerful buy signals
- Powerful sell signals
Understanding Candlesticks Patterns
Candlestick charts and patterns can be used in all time frames and when trading stocks, futures, forex, binary options, and every other market that have an open, close, high, and low.
If we look at a one minute time frame, one candle (session) represents that minutes' trading range:
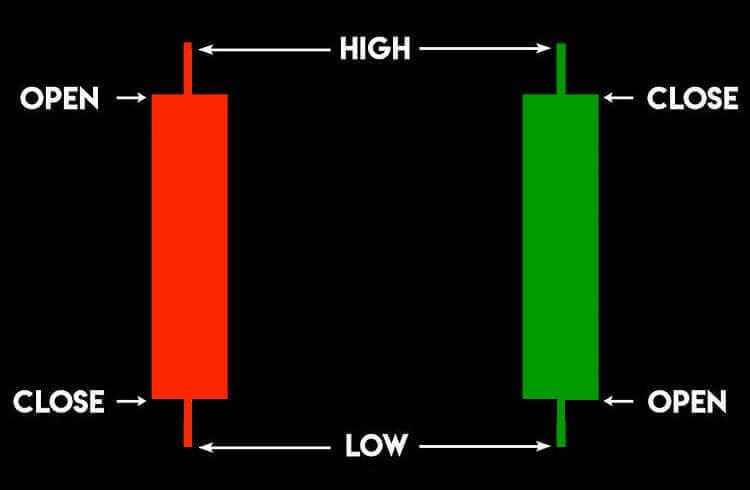
This is how the candlestick is constructed.
The painted section is the candle body.
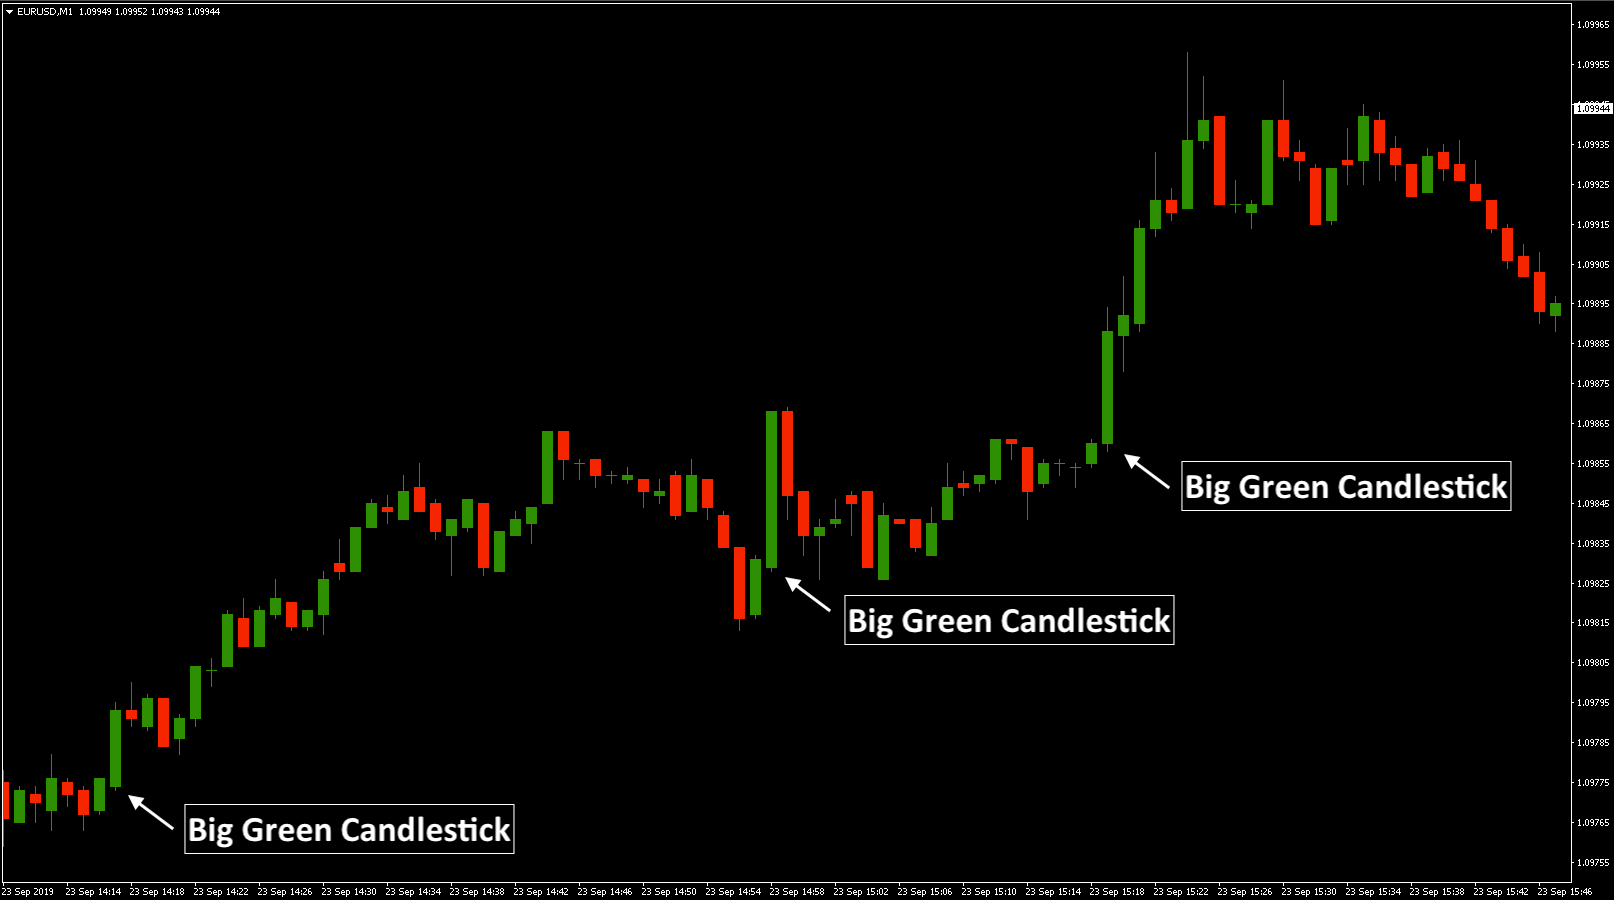
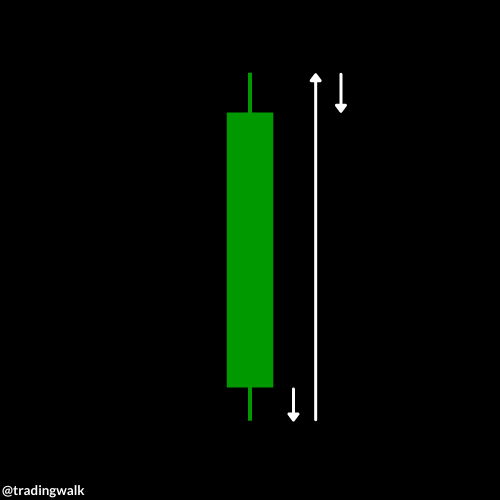
The candle body is green if the close is higher than the open:
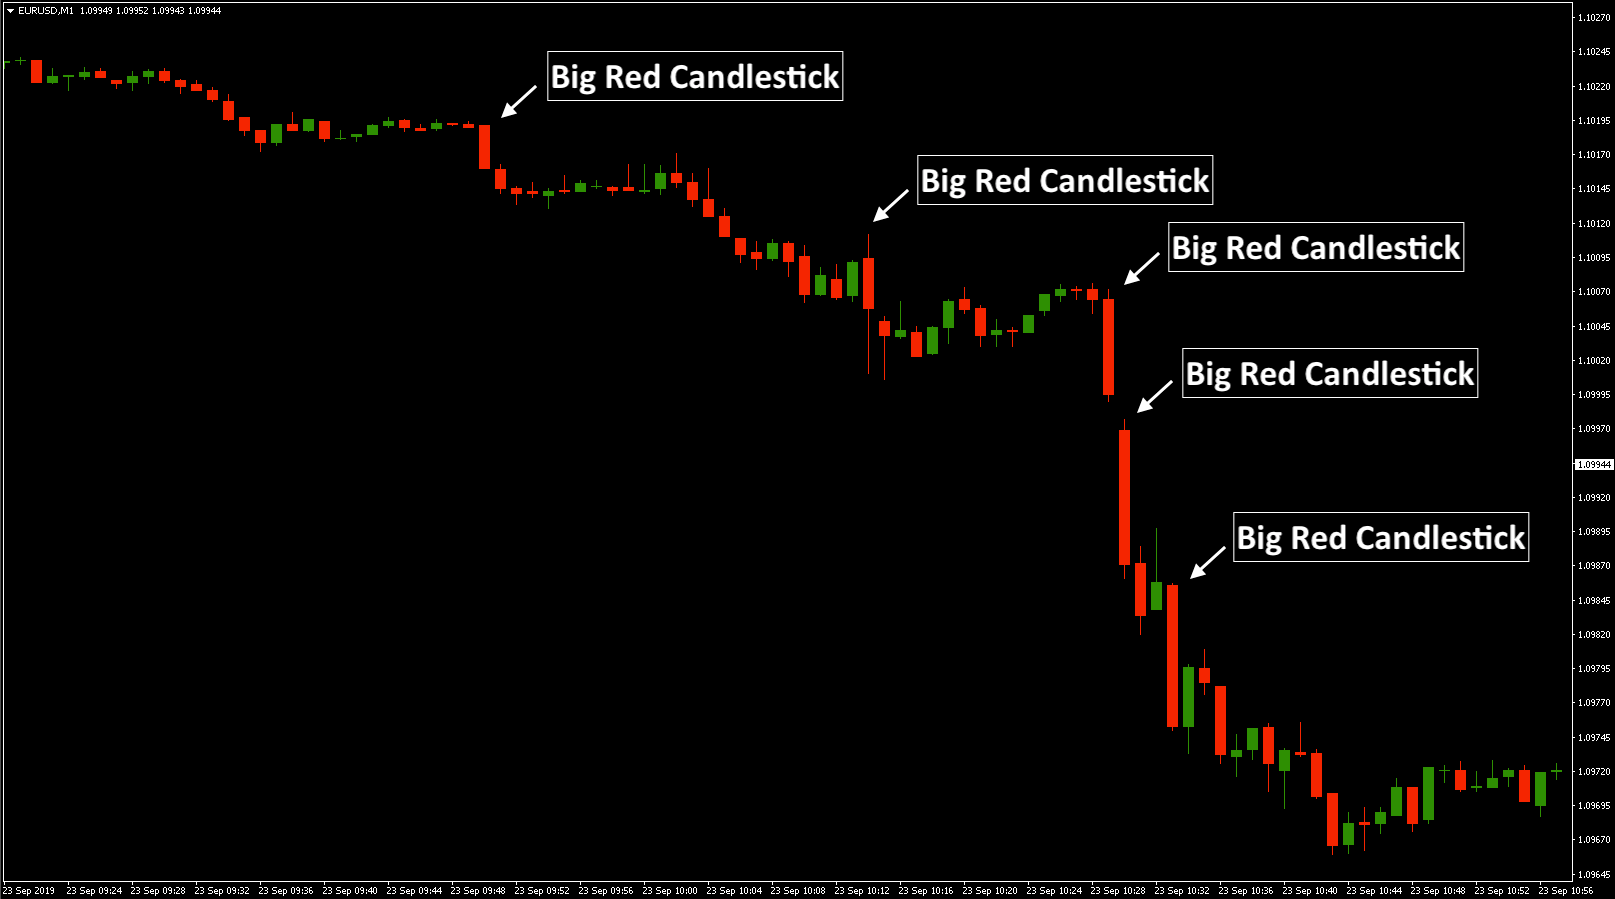
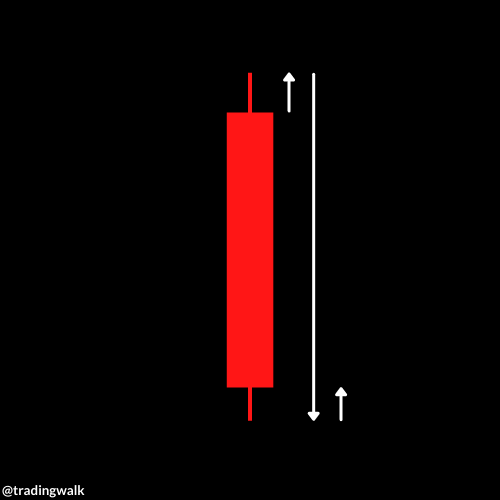
If the close is lower than the open, the candle body is red:
The lines above and below the candle body are called wicks, tails, or shadows. The top of the upper shadow is the session’s high and the bottom of the lower shadow is the session’s low of the day.
A sessions where the open and close have the same price, is called a doji candlestick.
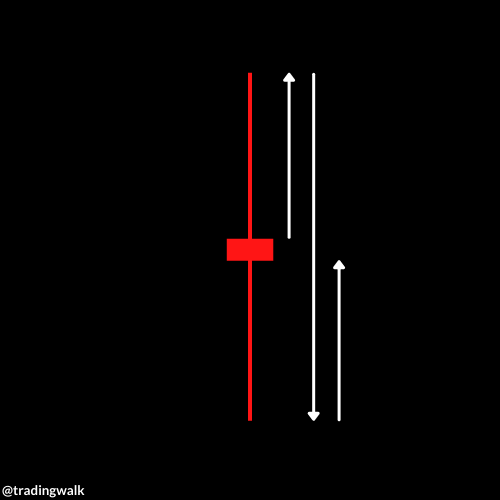
The doji is a candlestick where neither the buyers nor sellers control the session and, therefore, should alert us that the former trend may lose its momentum, or that the momentum is pausing and will later increase again.
Price Action Candlestick Trading vs Indicators
Remember that there is no holy grail out there. There is no strategy or method that will always work, you will not earn money to take a trade when the MACD crosses, or stochastic are oversold. Like most successful traders you need learn how to read the market dynamics and naked charts (charts with price only) first.
Learn to read the market dynamics, i.e. the relationship between buyers and sellers and you will not need indicators to guide you. Spend your time to learn to read the market, and not mass indicators. Keep in mind that every single person can read an indicator, hence will not give you any further edge in the market.
When starting out trading, you should always learn how to read the candlestick chart first (price action), and then add indicators if you feel they help.
In some cases indicators can add value, examples can be when you use a trend indicator like the 50 and 200 moving average that acts as support or resistance for a security in trends and you can act on that, or when you use a momentum indicator to find momentum changes (divergences) which you act on and profit.
That said, almost all technical indicators are based off either price, volume or volatility. If you know how to read price, volume or volatility in a price action candlestick chart, you do not have to rely on indicators when trading.
Before we discuss price action vs indicators and each type of support and resistance level let us define the trend.
Definition of a trend:
- In a rising trend (bull trend) tops and bottoms are rising to higher levels because there is an imbalance between supply and demand where the demand is greater than supply
- In a falling trend (bear trend) the reverse is true, tops and bottoms are falling because supply is greater than demand
- In a neutral trend supply and demand is in balance and price bounce between same price levels. Securities move in trend between these and if new highs are created the trend is up
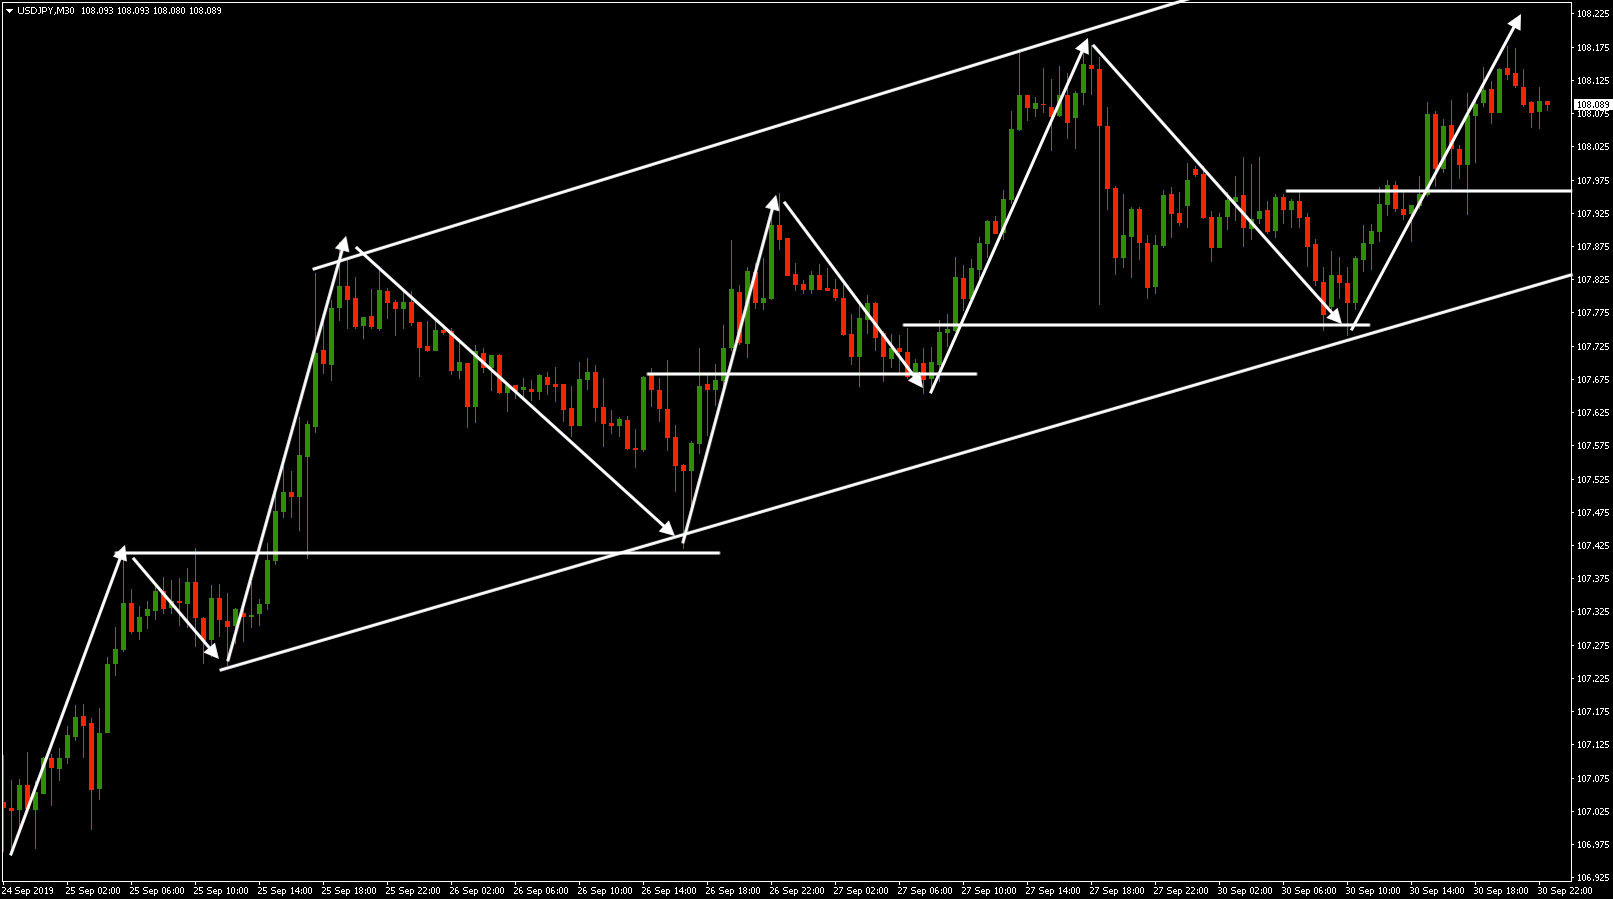
When price action is making higher highs and higher lows the trend is up (bullish):
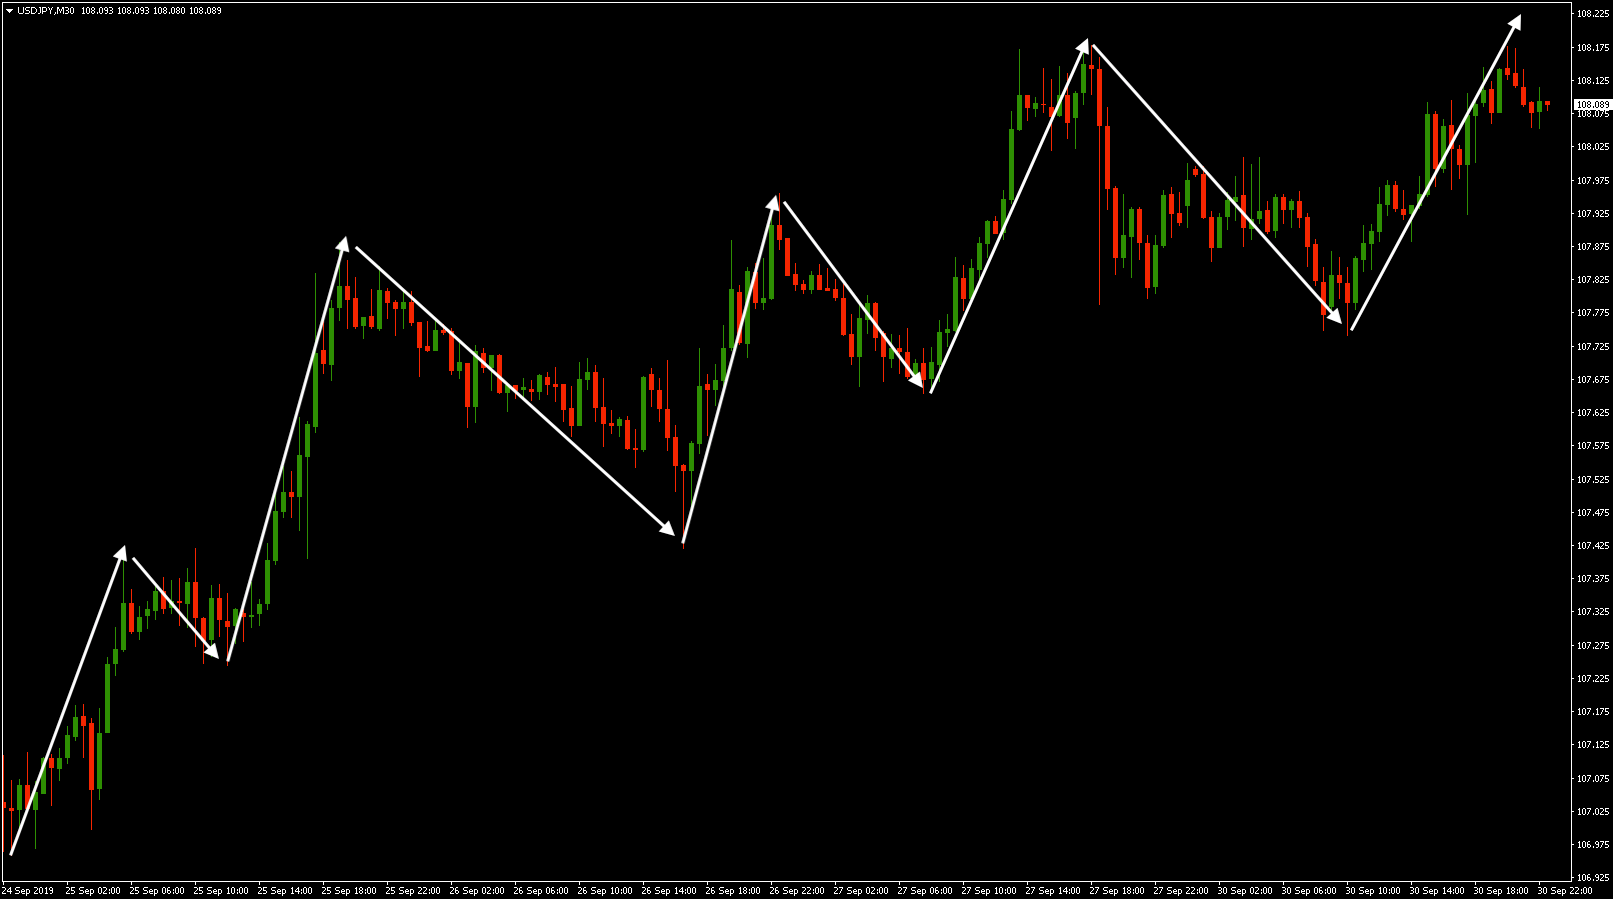
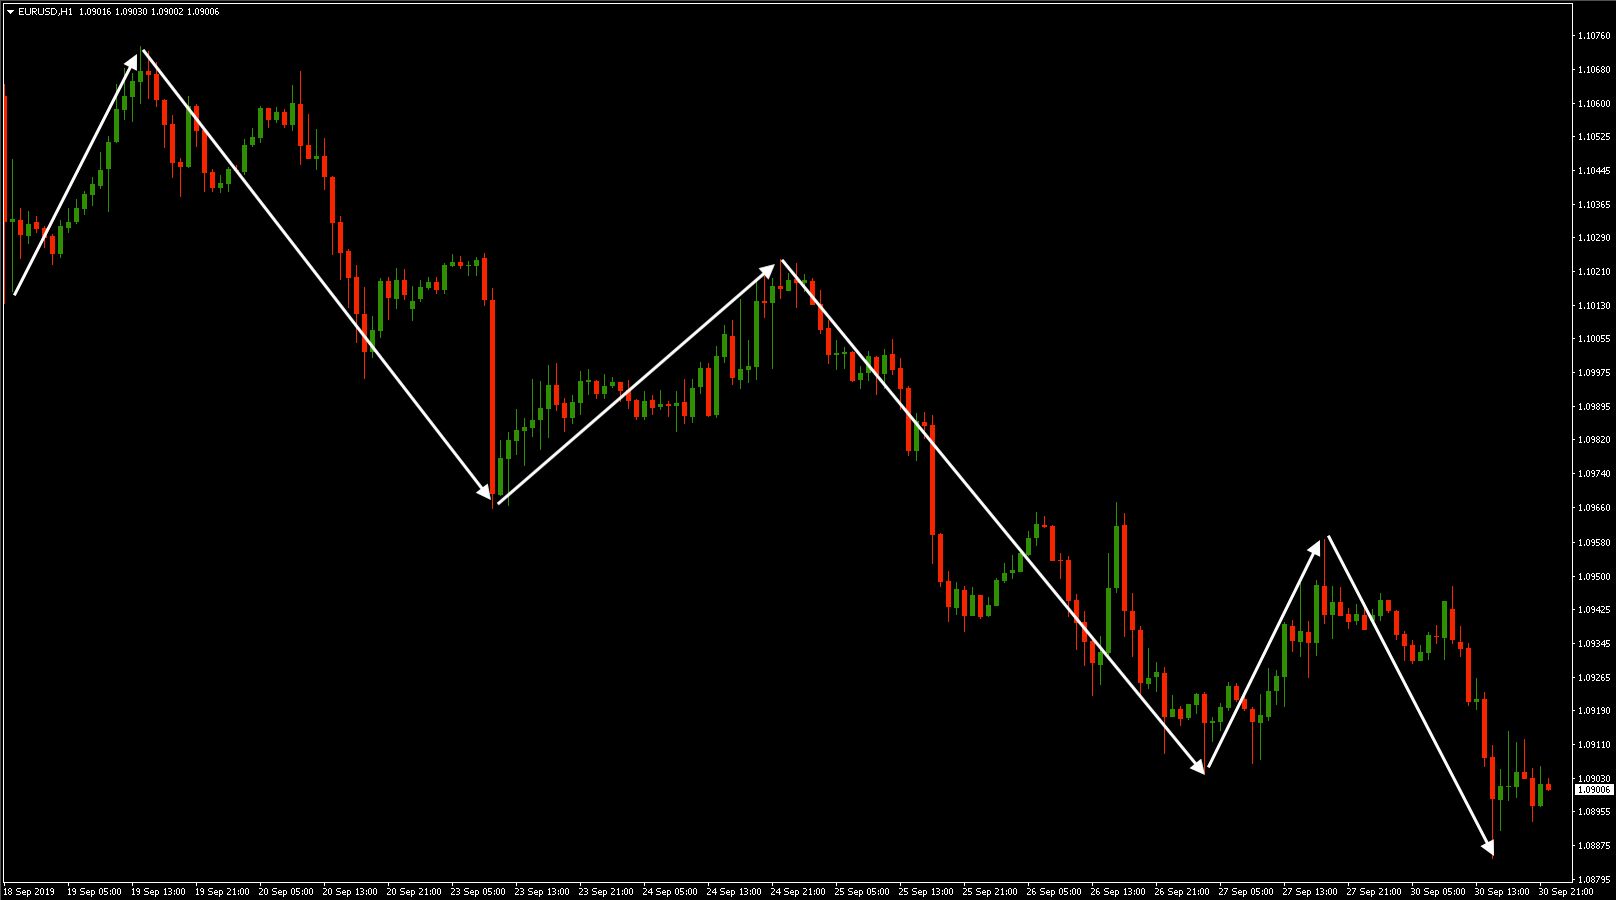
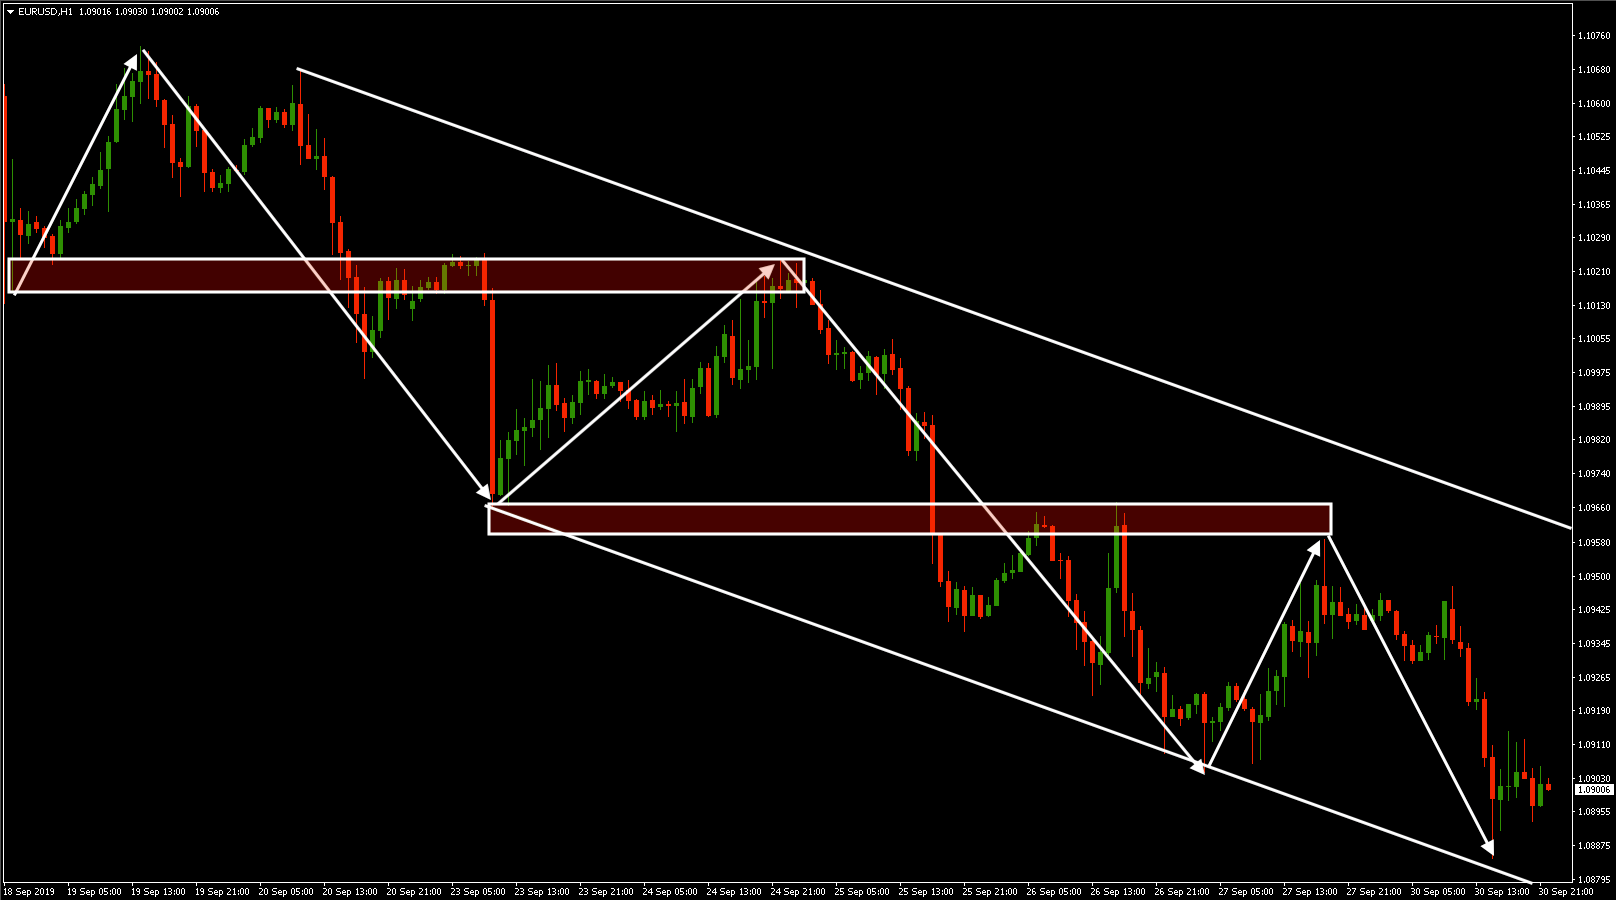
When price action is making higher highs and higher lows the trend is down (bearish):
Trend analysis is mainly an analysis of support and resistance levels created by horizontal price levels and trend lines. A security does not move in a straight direction, it moves more like waves with smaller and larger waves with tops and bottoms reacting between these horizontal levels.
Horizontal Price Action Levels
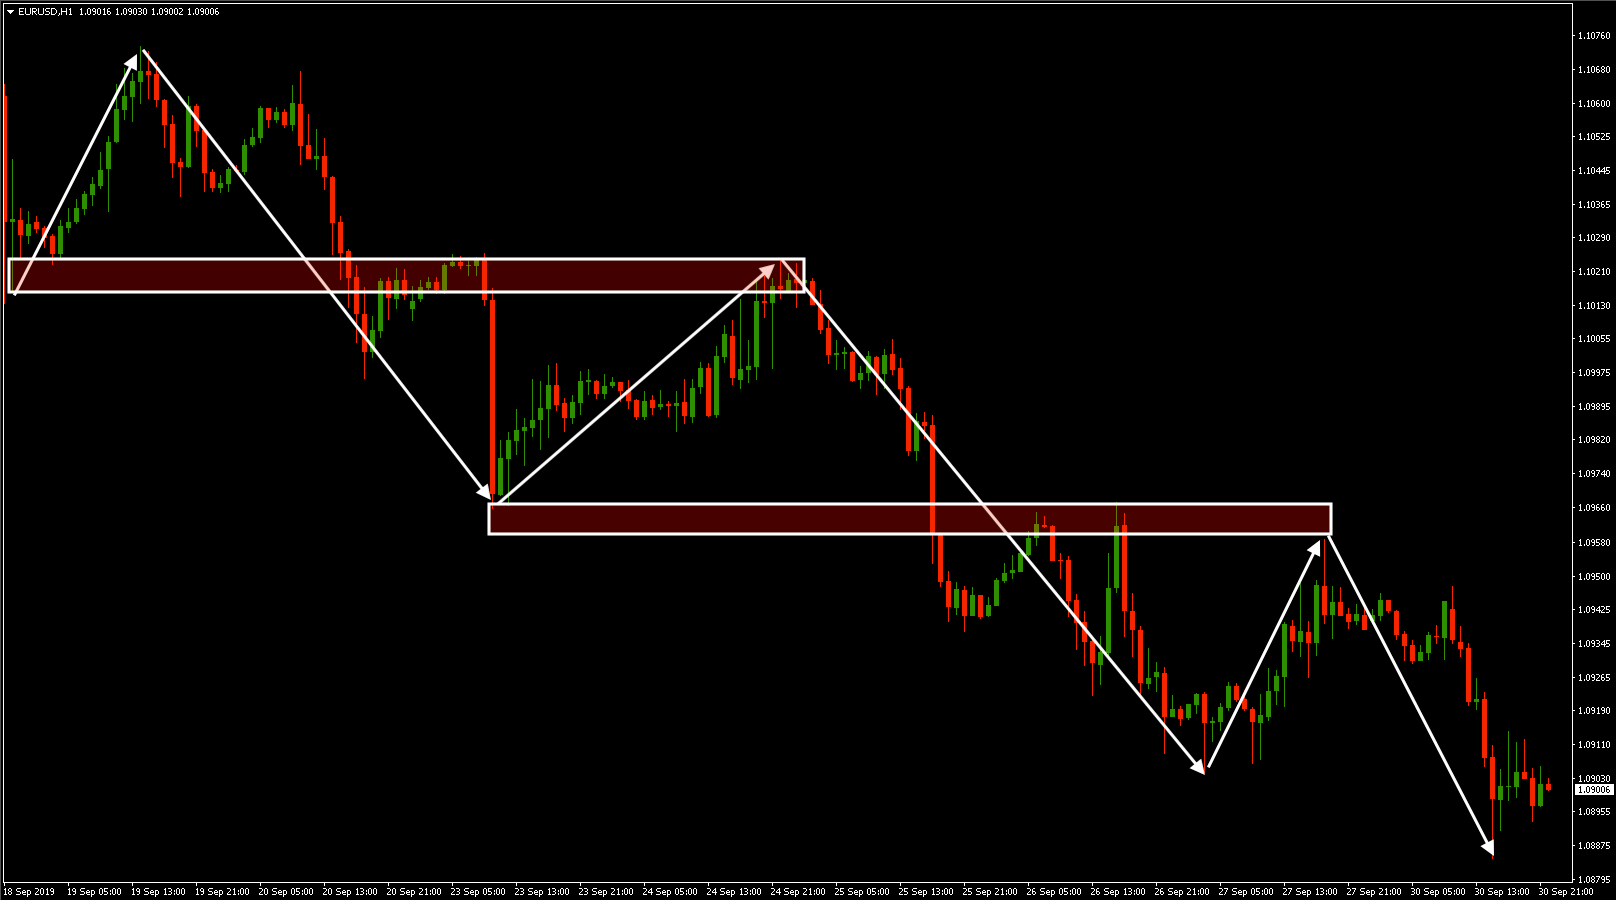
Horizontal price levels are the most powerful support and resistance trading levels because everyone can see them cause they are visually easy to spot. Locals tops and bottoms in a trend can be viewed as support and resistance levels.
Horizontal price levels that act as support or resistance doesn’t lose its importance after it's broken:
Gaps (price opens above or below yesterday’s highest or lowest price) are one other type of horizontal price level that is very powerful. We imagine a scenario that creates a gap up. The day of the gap the demand is so large that price opens above yesterday’s highest price. Because of this, we will probably see demand again if we come back to this price level.
There are some generalities on support and resistance. Among other, the longer a security stay at a price level the more significance this area will be in the future. The volume can be used to confirm how significant a support or resistance level is.
If a level is created with high volume that means that a lot of traders have acted on that level and can be an indication that the level will be more significant in the future than if a level was created without volume. The closer in time a support or resistance was created the more significant it will be.
This is because traders and investors tend to remember recent price moves and have interest these levels because they are invested above or below them. Learning investors behaviors is essential when trading price action.
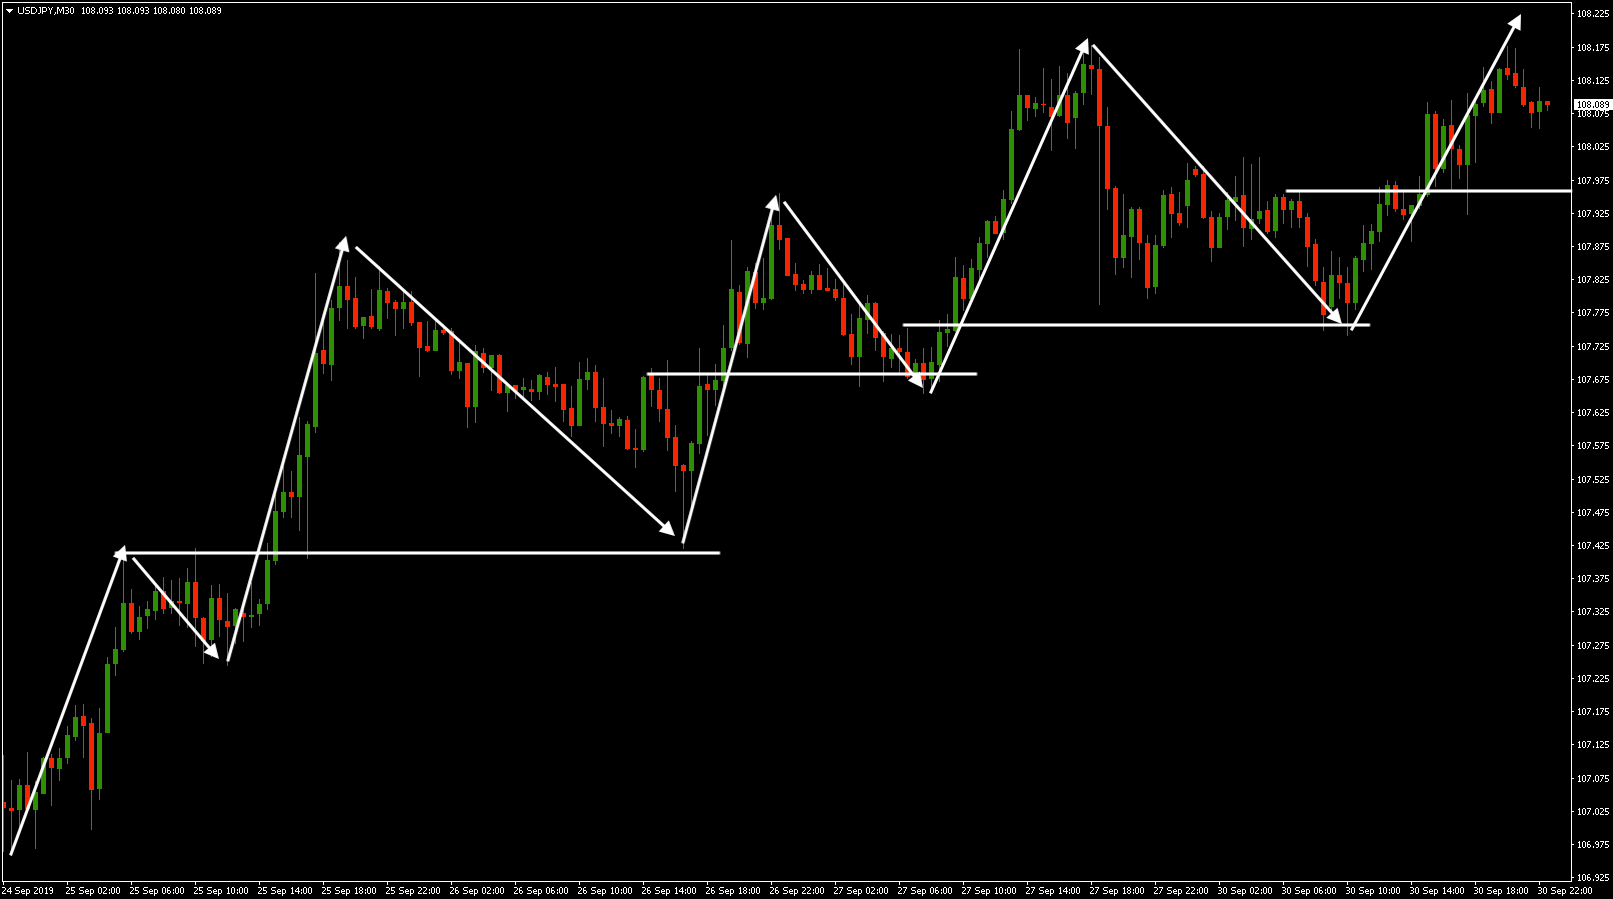
In a bullish trend, last resistance in a pullback often gives support into the future:
Characteristics Of Support And Resistance
A common misconception when reading the literature about technical analysis is that support and resistance levels are exact. This means that you can draw a thin line at a certain price and expect an accurate bounce at this price.
The truth is often sadly quite different. Levels are not exact and should rather be seen as a zone. The more volatile a market is, bigger the distance between the upper and lower levels of these zones. Occasionally, we have low volatility and then the zones are smaller and more precise.
When we have high volatility, the respect for support and resistance zones reduces. Zones are those spots on the chart where the price has reversed more than one time. The general rule on the strength of a zone; the larger number of people who see a zone, more important it becomes.
The strength of a zone is determined by:
- Number of hits
- How accurate it is (distance between the upper and lower level)
- The speed of the market
- How close present hits are
- If it is close to an even number i.e. 1000
- Seen in many time frames (a zone we only see in a smaller time frame, say 5min is not as strong as a zone seen in the 4h, 30min, and 5min. The larger number of people who see the zone, more important it becomes.)
Trend Lines
Trend lines are used to get a visual overview in what direction the trend is going. The lines can be used to find support and resistance levels but we don’t recommend it since there are a million ways to draw a sloping trend line and, therefore, they will not give you an accurate price level other traders and investors look at.
They are however good to use to get a warning on potential trend reversals.
A rising trend line is drawn from left to right connecting rising bottoms. You need at least two bottoms where the second is higher than the first to draw a rising trend line. A falling trend line is drawn from left to right connecting falling bottoms.
There are some generalities on trend lines. The longer the trend line is valid the more significant it becomes, trend lines drawn over several years is viewed to be more significant than a trend line drawn over a few days since the second have a higher probability of being broken.
As with support and resistance lines, the more times the line is tested the more significant it becomes. The larger trend line in the chart below is still valid while the trend lines are drawn between fewer days often breaks.
Trend Indicators
Trend indicators intended use is to identify the trend.
The most used trend indicator is the moving average.
You can, in most cases, find a link between a moving average and the security. An example is that the security signals demand pressure when the price reaches a moving average and supply pressure when it's extended.
The indicator determines the trend direction from the number of periods it is calculated on. If the price is above the moving average, the trend direction can be defined as up.
The choice of moving average length (periods it is calculated on) determines how sensitive the moving average is. The shorter length you use, the more sensitive and faster it is and reacts to new price moves.
There are a number of ways to calculate the moving average, but the two most common ones are simple and exponential moving average.
Additional popular trend following indicators includes MACD, Channel indicators, ADX, etc.
Momentum Indicators
Momentum indicators intended use is to identify securities overbought and oversold areas.
According to momentum indicators, the definition of overbought is when the security you trade rises above a price of balance and becomes expensive relative to the prevailing trend.
Momentum indicators are also used to analyze the strength or speed of the trends in securities. If the security you trade is trending and the price rises but the strength or speed of the price move decrease shown by a momentum indicator indicates a divergence and that the trend might be over.
There are many different momentum indicators, and almost all give you the same information.
RSI and Stochastic are the best and most used momentum indicators for beginners.
How Many Indicators Should You Use?

Johan Nordstrom is a full-time trader, and a family guy in his early 30's who trades the markets in a simple yet effective way. He has a master's degree in risk management and years of experience trading the markets. He has helped hundreds of struggling traders become consistently profitable. Read more.
What To Read Next