Best Fibonacci Retracement Strategy
Want to learn how to draw and trade Fibonacci retracement levels in an easy and profitable way?
In mathematics, the Fibonacci numbers are the numbers in the following integer sequence, called the Fibonacci sequence, and characterized by the fact that every number after the first two is the sum of the two preceding ones.
In technical analysis, Fibonacci retracement levels are created by taking two extreme points (usually a major swing high and swing low) on a chart and dividing the vertical distance by the key Fibonacci ratios of 23.6%, 38.2%, 50%, 61.8% and 100%.
Why Fibonacci Retracement Levels Work
The major reason why Fibonacci retracement works is because the patterns appear in nature and many traders swear by these support and resistance levels.
When a Fibonacci retracement level is identified on a higher timeframe chart, you can be sure that a large number of traders will be watching that level, many of them having existing orders around the strong level.
The Fibonacci retracement levels are some of the best support and resistance trading levels.
How and where to enter trades using Fibonacci retracement levels gets really easy when you’re using the simple Fibonacci trading strategy in the video above.
The most important Fibonacci ratios/retracements are the 38,2% the 50% and the 61,8% levels.
Build your Fibonacci trading method around these support and resistance levels, and your trading account will thank you.
Remember; trading strategies you trade in the direction of the trend will give you a good risk-reward and high win rate.
My favorite trading strategy to trade Fibonacci retracement levels is to wait for an entry signal using the 10X Trading System to confirm the level and enter a trade confidence.
How To Draw Fibonacci Retracements
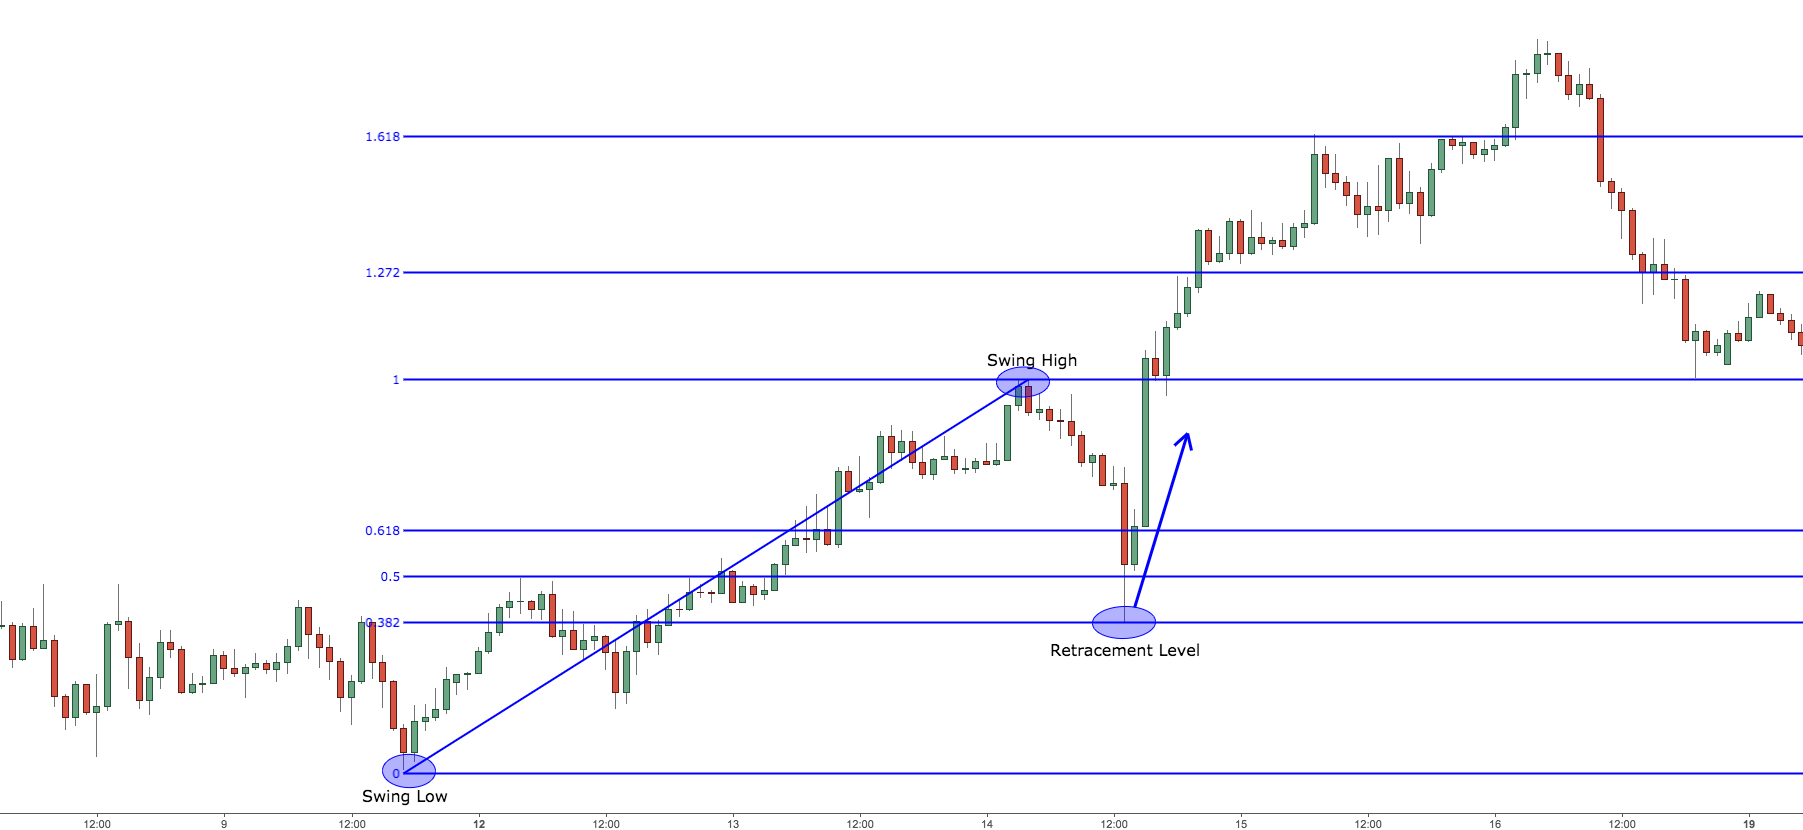
To draw Fibonacci retracement levels on your charting software, you'll need to identify two extreme points on a chart, such as a major swing high (top) and swing low (bottom).
Once you have these points, you draw the Fibonacci tool between these two points. This will create horizontal lines, Fibonacci retracements, that will act as good support and resistance levels.
How To Trade Fibonacci Retracements
Fibonacci Retracement For Beginners
- Find recent swing highs and swing lows on your chart.
- Draw the Fibonacci indicator between recent high and low.
- Trade in the direction of the trend.
- When resistance levels break (up trend, new highs are formed), you want to enter on a 10X buy signal at the first test of a Fibonacci retracement support level that you have drawn between the most recent high and low.
- When support levels break (down trend, new lows are formed), you want to enter on a 10X sell signal at the first test of Fibonacci retracement resistance level that you have drawn between the most recent high and low.
Fibonacci Retracement Bounce Strategy

EURUSD 4 hour chart by TradingView
USDJPY 4-hour chart by TradingView

USDCAD 4-hour chart by TradingView
Fibonacci Extension Levels Targets
The 127.2% Fibonacci extension is a key level that traders use to set take profit targets.
For example:
If you take an entry on a 10X buy signal at the 50% Fibonacci retracement and use the 127.2% Fibonacci extension as your take profit target, you will usually have a good 5+ risk reward ratio trade.

TSLA daily chart by TradingView
However, it's important to note that the price may not always stop exactly at this level and can continue to move if the momentum is strong. Many traders will take partial or full profits at this level, as the price may slow down or consolidate before potentially reversing or continuing.
In addition to the 127.2% Fibonacci extension level, there are also a key Fibonacci extension level at 161.8% above it.
So when trend momentum is strong you can set your take profit targets at the 161.8% level instead of the 127.2% level.
Does Fibonacci Trading Work?
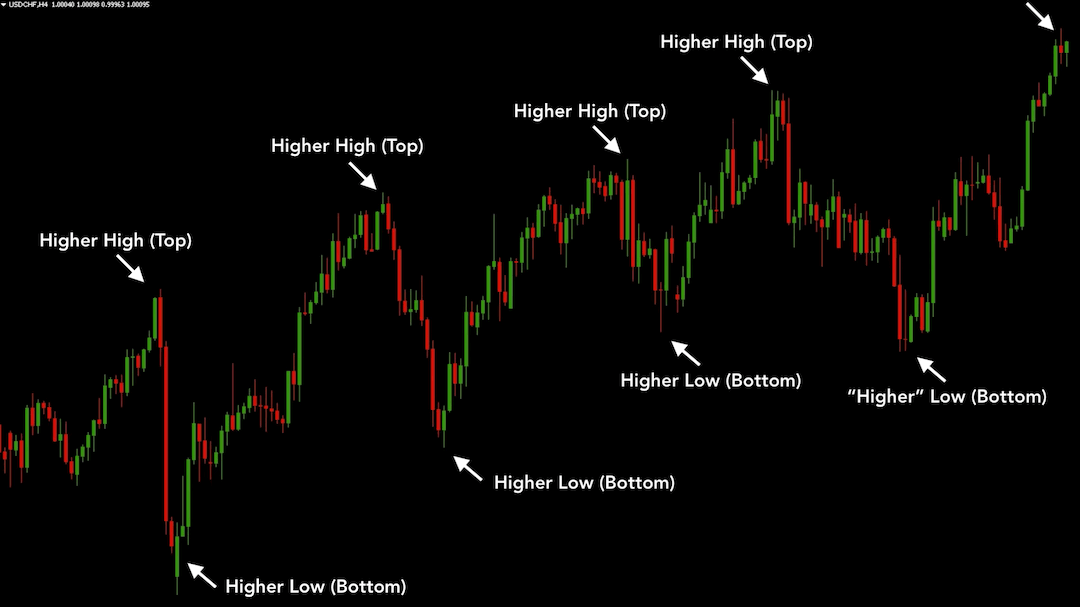
USDCHF 4-hour chart by TradingView
Mastering Fibonacci Retracement Levels
The key to mastering Fibonacci retracement levels is to trade in the direction of the trend and only trade at strong Fibonacci levels. I prefer the 38.2%, 50%, and 61.8% Fibonacci retracement levels.
But there's a catch.
Price bouncing on Fibonacci levels are rarely to the point.
What helps many traders is thinking of the zone between the 38.2% and 61.8% Fibonacci levels as one big support or resistance zone.
Support in uptrends.
Resistance in downtrends.
When the trend is up, and you trade buy signal at this Fibonacci support zone, you can enter a trade with a high probability of a successful trade.
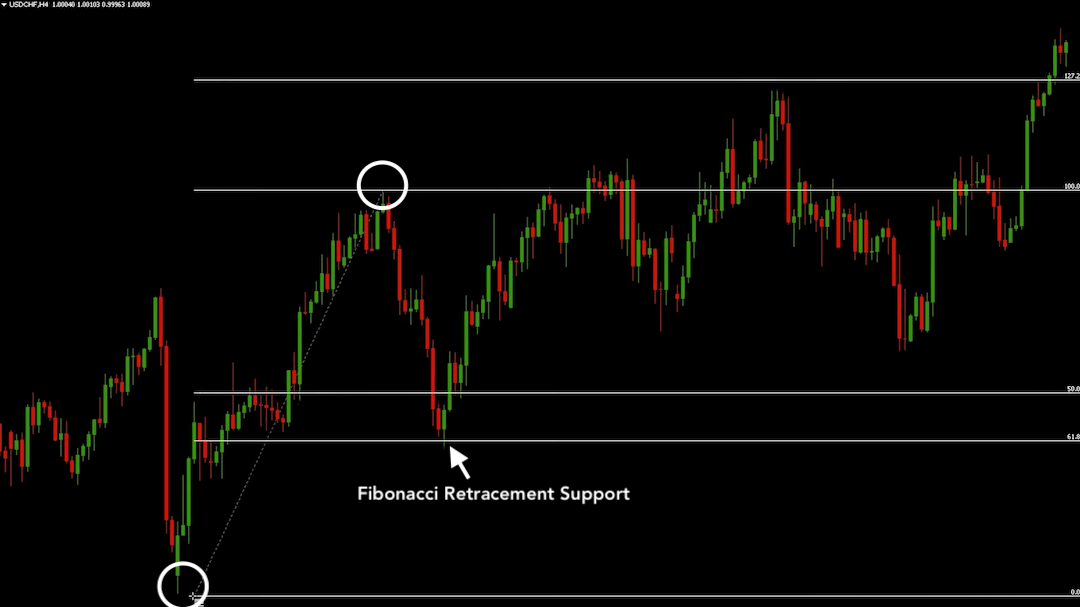
USDCHF 4 hour chart by TradingView
Best Time Frame For Fibonacci Retracement
Most traders who are doing technical analysis look at the daily and the 1-hour time frame.
So it's natural that tops and bottoms and levels on these two time frames will be significant.
Therefore Fibonacci retracement levels you get by drawing your Fibonacci tool between these tops and bottoms will be significant.
But more traders look at the daily time frame over the 1-hour time frame.
Here's the point:
The daily time frame is the best time frame for Fibonacci retracement levels.
How To Draw Fibonacci Retracement Correctly
Do you draw between the tops and bottoms of the candlestick body or candlestick wick?
Well, why would you ignore the buyers and sellers who price action?
There is buying and selling pressure at every level where orders have taken place, so you want to draw between the candlestick wick tops and bottoms.
You draw and trade Fibonacci retracements correctly by drawing between an absolute top and bottom to consider all the buying and selling pressure in that period.

Johan Nordstrom is a full-time trader, and a family guy in his early 30's who trades the markets in a simple yet effective way. He has a master's degree in risk management and years of experience trading the markets. He has helped hundreds of struggling traders become consistently profitable. Read more.
What To Read Next