How To Read Candlestick Charts Like A Professional Trader
Learning and understanding how to read a candle chart is the best way to read price action.
Why does this matter?
Because reading price action using candlesticks will help understand the market sentiment (buyers and sellers strength) and crowd psychology, that's essential for both beginners and professional traders.
Reading candlestick charts, you will understand the activity in the market and get early warning signs.
Are buyers or sellers in control?
Are buyers or sellers losing momentum?
Those simple questions and answers can give you an edge.
However, reading candlestick charts and patterns can be difficult, especially if you're a beginner.
So why do you want to trade candlesticks vs. line charts?
And what can the candlestick components tell you?
Let's cover the best tips for reading and understanding candlestick charts like a pro.
understanding candlestick charts
Candlestick charts are a Japanese way of reading price action.
Candlesticks were initially used for trading rice in the 1600s and onwards.
They are available and free to use on most technical analysis charting platforms.
Candlestick charts display the absolute values of the open, high, low, and closing prices for a given time frame.
For example:
One month, one week, one day, 4-hour, 1-hour, 15-minute, 5-minute, or 1-minute time frame.
how to read candle charts
Candlesticks consist of a 'body' made of a colored rectangle and two wicks (also called shadows or tails), one above and one below the candle body.
The complete lack of wicks has significance in most candlestick patterns.
If the open and the close are at the extreme high or low of the candlestick, there will not be any wicks.
Candlestick components:
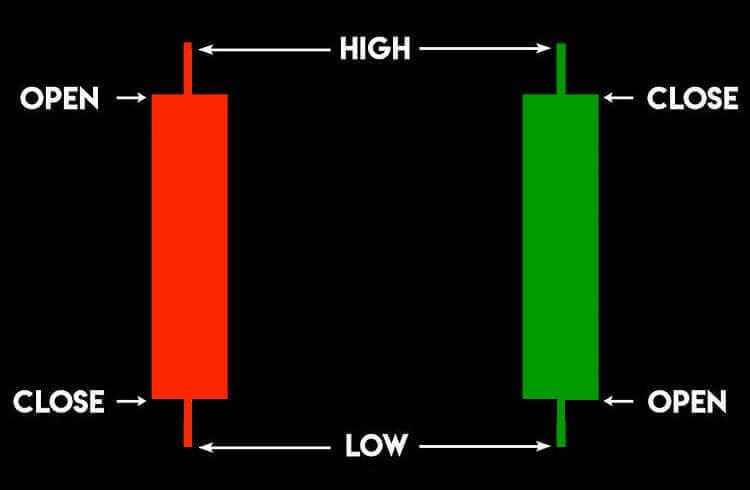
So how do you read candlestick charts?
The highest point of the upper tail represents the highest traded price for that time frame.
The lowest point of the lower tail represents the lowest traded price for that time frame.
You find each time frame’s opening and closing price at the horizontal levels of the rectangular body.
The opening price is at the bottom of a green candle, and the closing price is at the top of a red candle.
The closing price is at the top of a green candle, and the closing price is at the bottom of a red candle.
How to read candlesticks price action of a bullish green candlestick:
So if the market closes higher than the opening, the body is white or green, with the bottom of the rectangle representing opening price and the top of the rectangle representing closing price.
How to read candlesticks price action of a bearish red candlestick:
So if the market closes lower than the opening, the body is red, with the top of the rectangle representing opening price and the bottom of the rectangle representing closing price.
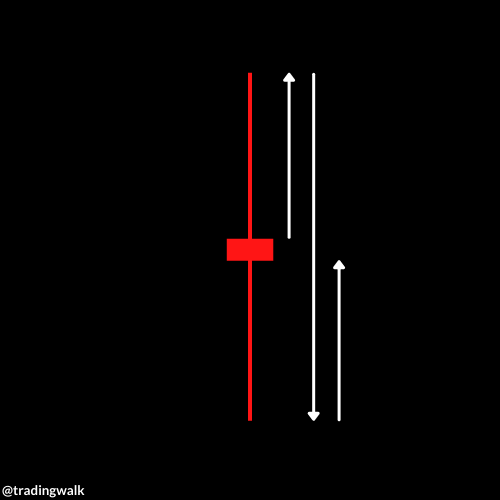
When the opening and closing price are identical or very close, the body is replaced by a horizontal line, forming a doji candlestick pattern.
If the opening and closing price are very close, both a green and red candle body can be a doji.
How To Trade Candlestick Charts
Learning how to trade candlestick charts is easier when you trade a trading system based on price action, trends, and levels. The 10X signals and strategies have helped hundreds of members become profitable traders.
Why Do Candlestick Trading Work?
Candlestick trading works because they provide you non-lagging information about price action in each time frame in a visual way.
Candlestick charts are easy to read, allowing you to make decisions with a glance at your chart.
Reading each candlestick can help you predict the next price move and understand market behavior.
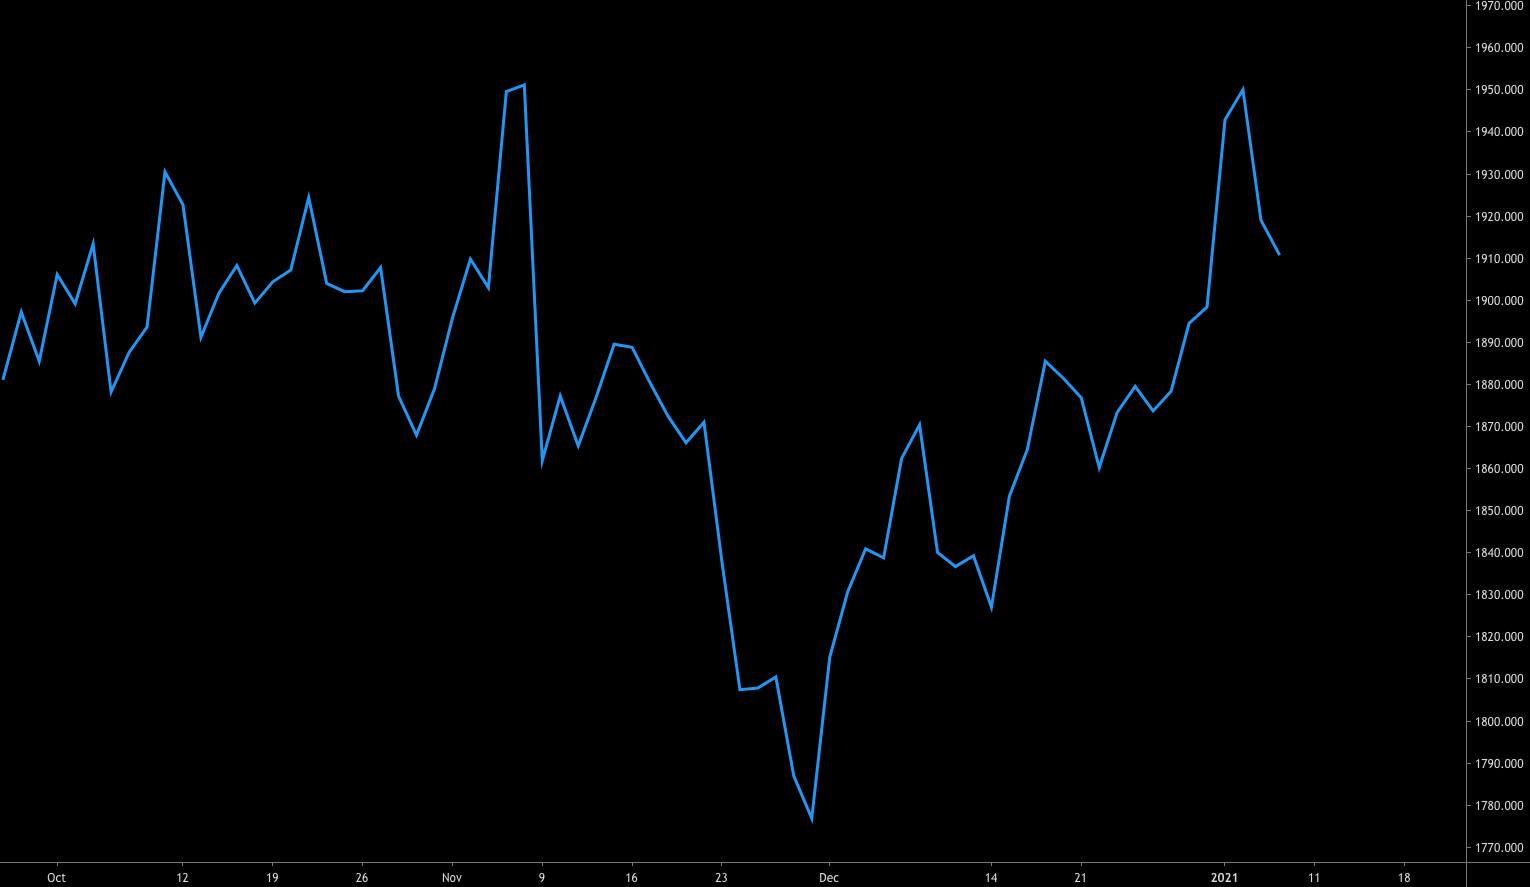
So are candlestick charts better than bar charts and line charts?
In the charts below, you can see the visual advantage of candlestick charts over line charts.
Candlestick vs. Line Chart
So are candlestick charts better than line charts?
In the charts below, you can see the visual advantage of candlestick charts over line charts.
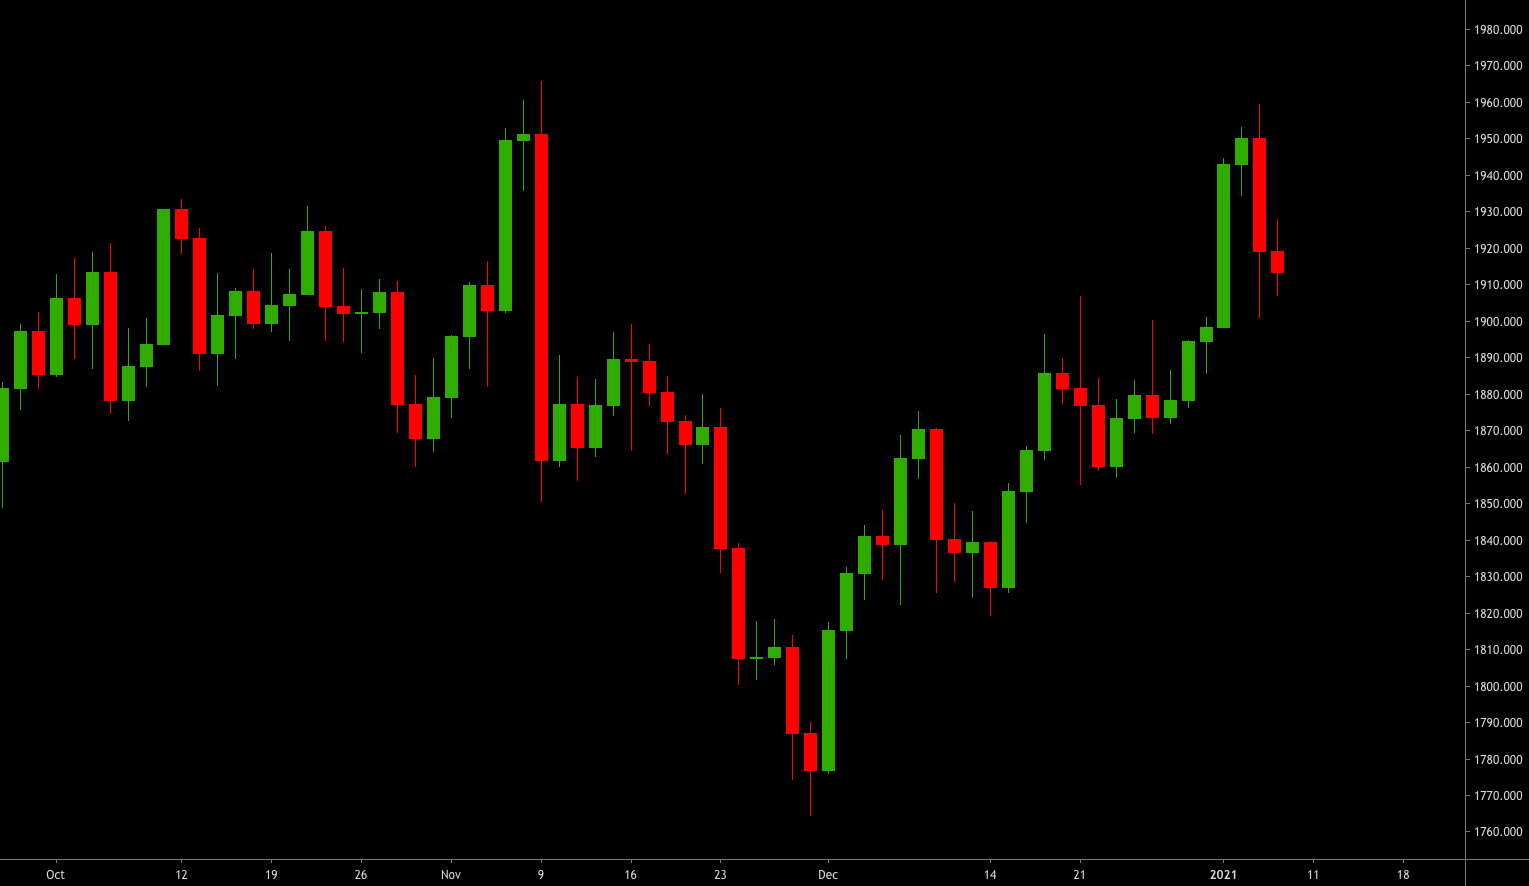
The candlestick chart below gives you a clear buy signal at the low with a bullish candlestick pattern.
While the line chart only shows a line giving you very little information to help you find entry points.
One of the advantages of candlestick charting is seeing the overall price action in an easy to read way.
While line charts reveal direction but not so much more, each candlestick tells a story.
The short-term trends in each time frame are easily spotted by analyzing each candlestick.
Simple Way To Read Trend With Candlestick Charts
With candlesticks, you can spot trends quickly by looking at the colour and size of candles.
So the way to read trend with candlestick charts is to look at the size of the candlestick bodies and the length and position of the wicks.
How to read a single candlestick:
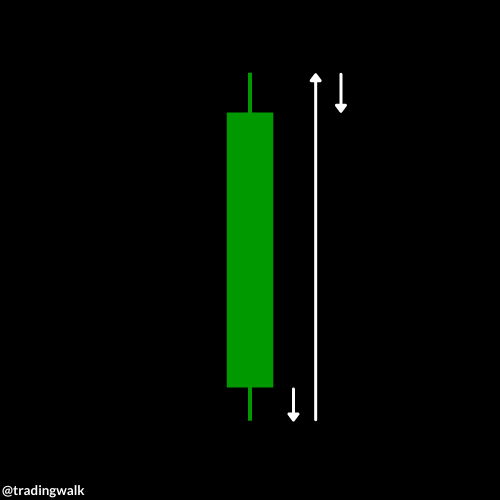
A green candlestick with a small or no tail above the body indicates an absolute control by buyers.
A green candlestick with a long upper tail beyond its body indicates a more uncertain period. Buyers' effort to push the price higher was pushed back by sellers' pressure before the candlesticks' close.
Example for a candlestick chart:
If price action shows you more green candlesticks with small or no lower wicks, the trend is bullish.

You can see the size of the green candlesticks is more significant, indicating a healthy bullish uptrend.
You also see the loss of momentum in the form of smaller candlesticks just before reversal points.
The line chart shows you the trend, but it doesn't give you the information each candle gives you.

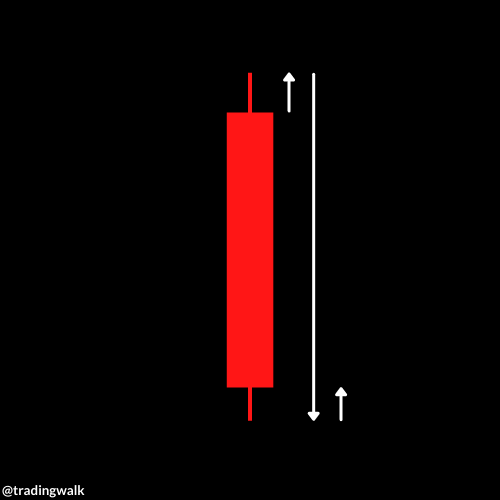
If price action shows you more big red candlesticks with small or no upper wicks, the trend is bearish.

There are more red bearish candlesticks than green candlesticks.
You can also see the size of the red candlesticks is more significant.
This is indicating you that we have a healthy bearish downtrend.
You also see the loss of momentum in the form of smaller candlesticks just before reversal points.
The line chart shows you the trend, but it doesn't give you the information each candle gives you.

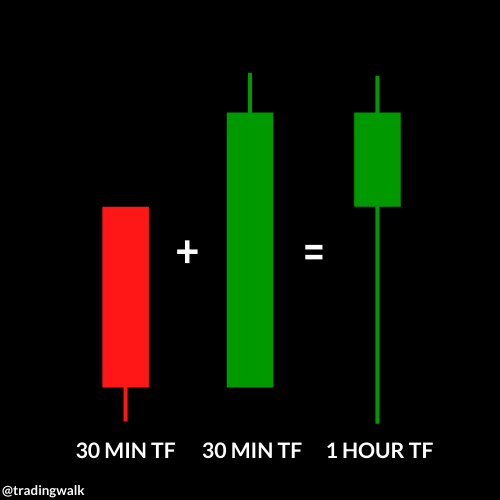
Lower Time Frame Candlestick Patterns On Higher Time Frame Chart
Each candlestick tells a story across all time frames.
You can see how candlestick patterns are formed on a higher time frame chart buy analysing the price action and candlestick patterns on a lower time frame chart.
For example:
Four green candlesticks closing higher on the 15 minute time frame will show as one green candlestick on the 1 hour time frame.
Three red candlesticks closing lower on the 5 minute time frame will show as one red candlestick on the 15 minute time frame.
These two candlesticks on the 30 minute time frame will show as a hammer on the 1 hour time frame:
These two candles on the 15 minute time frame will show as a doji on the 30 minute time frame:

Understanding Candlestick Charts
So how can we understand candlestick charts on a deeper level?
Here's the deal:
What creates candlestick patterns are the change in market sentiment (buyers and sellers strength) and crowd psychology.
For example:
A red candlestick that completely engulfs a green candlestick (the red candlestick size is larger than the green candlestick) shows that the sellers are now in control.
Everyone who bought in the green candlestick is now in a losing position.
So most traders who bought in the green candlestick are most likely going to start selling, which often leads to more selling, and prices continue to fall.
Candlestick traders who understand the change in sentiment and how other traders most likely react to price movements and candlestick patterns provide the candlestick traders with an advantage.
Candlestick charts also makes it easier for you to deal with the psychology of trading and feelings like greed and fear. Understanding candles will give you the confidence to avoid anxiety and fear of trading.
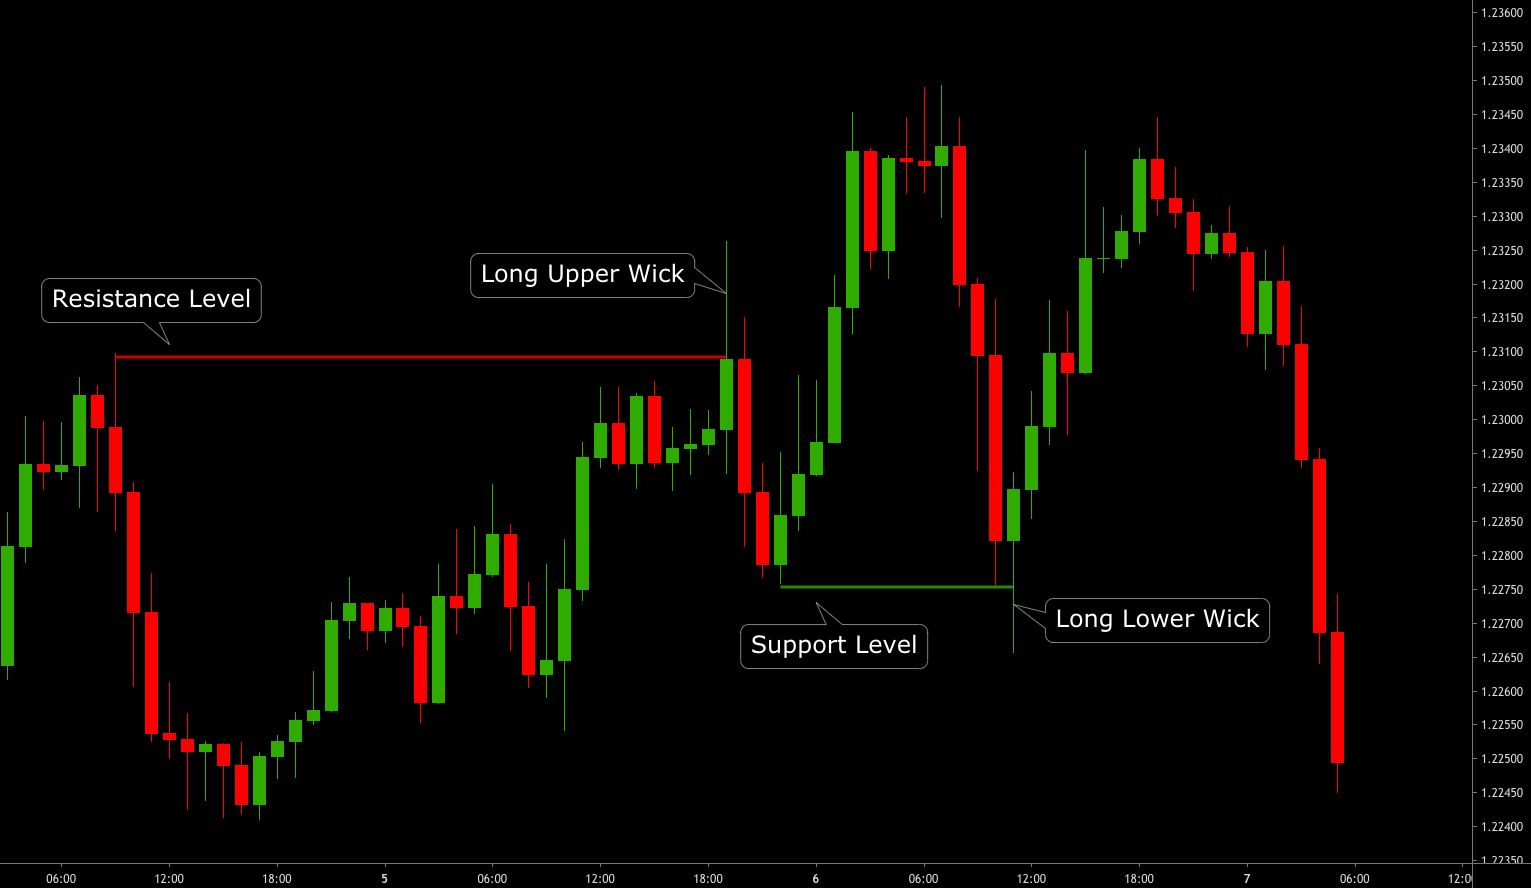
How To Read A Candlestick Wick
There are two ways wicks can help you in your analysis and trading.
First, they can give you an early warning of the possible trend change by showing momentum loss.
For example:
Suppose you see three or more long wicks below the candle body at the absolute bottom of your chart.
In that case, the selling momentum and trend are weak, and there's a high probability that the sentiment will change to bullish.
Suppose you see three or more long wicks above the candle body at the absolute top of your chart.
In that case, the buying momentum and trend is weak, and there's a high probability that the sentiment will change to bearish.

Second, they can give you accurate entry points at support and resistance levels.
For example:
The meaning of a very long lower candlestick wick at a support level shows a fast change in market sentiment from selling to buying, indicating a high probability of a change in direction.
Similarly, the meaning of a very long upper candlestick wick at a support level shows a fast change in market sentiment from selling to buying, indicating a high probability of a change in direction.

Johan Nordstrom is a full-time trader, and a family guy in his early 30's who trades the markets in a simple yet effective way. He has a master's degree in risk management and years of experience trading the markets. He has helped hundreds of struggling traders become consistently profitable. Read more.
What To Read Next